

Stochastic Momentum Index (SMI) Pine Script
The Stochastic Momentum Index measures the close relative to the midpoint of a recent high-low range. This page gives you a working Pine Script v6 example, the formula behind it, and a practical way to test the 10-3-3 baseline. The code uses ta.highest(), ta.lowest(), and nested ta.ema() calls, double EMA smoothing, and a separate signal line.
When I review a generated SMI script, I first check that the lookback, smoothing lengths, and plotted thresholds match the written strategy. I then test the same rules on the intended symbol and timeframe. The indicator does not predict price.
What Is the Stochastic Momentum Index (SMI)?
The Stochastic Momentum Index (SMI) is a momentum oscillator that compares the closing price to the midpoint of the high-low range using double exponential smoothing. Unlike the regular stochastic oscillator which ranges from 0 to 100 and uses the lowest low as its floor reference, the SMI oscillates between -100 and +100 and measures from the center of the trading range. The centered scale makes positive and negative readings symmetric. A reading above +40 means the close has moved well above the range midpoint. A reading below -40 means it has dropped well below it. The 0 line acts as the center reference: above 0 means the close is above the midpoint, below 0 means it is below.
History and Inventor
William Blau introduced the Stochastic Momentum Index in his 1993 book "Momentum, Direction, and Divergence" as a direct improvement on George Lane's traditional stochastic oscillator. The calculation compares the close with the midpoint of the high-low range, then smooths both sides of the ratio. TradingView's SMI reference documents the same centered range and double-smoothing method.
How It Works
The SMI calculation works through four steps. First, find the highest high (HH) and lowest low (LL) over K periods. Second, calculate the full range (HLR = HH - LL) and the relative range (RR = close - midpoint, where midpoint = (HH + LL) / 2). Third, apply double EMA smoothing to both RR and HLR using the D length. Fourth, divide the smoothed RR by the smoothed HLR and multiply by 200 to get a -100 to +100 scale. The result is then fed through one more EMA (the EMA Length) to produce a signal line. Some strategies treat a signal line crossover above +40 as a bearish warning and one below -40 as a bullish warning, but the rule still needs a defined confirmation.
SMI Formula
HH = highest(high, K)
LL = lowest(low, K)
Range = HH - LL
Midpoint = (HH + LL) / 2
RR = Close - Midpoint
SMI = 200 * (EMA(EMA(RR, D), D) / EMA(EMA(Range, D), D))
Signal = EMA(SMI, EMA_Length)
Where K = 10 lookback period, D = 3 double-smoothing period, and EMA_Length = 3 signal line period by default
What Markets It Suits
The SMI can be calculated for stocks, crypto, forex, and futures because it only needs high, low, and close data. Market labels do not tell you which setting will work. Volatility, timeframe, session, and the surrounding strategy change the result. Treat +40 and -40 as configurable reference levels rather than fixed entry or exit rules.
Best Timeframes
There is no best timeframe for every SMI strategy. Shorter charts create more observations and more market noise, while higher smoothing values add lag. The 10-3-3 setup is a baseline, not a claim that Daily or 4H signals will be profitable. Keep the symbol, timeframe, date range, fees, and trade rules fixed when you compare settings. When I compare SMI settings on SPY, AAPL, or BTCUSDT, I change one parameter at a time so the result remains interpretable.
Type
Momentum Oscillator
Best Timeframes
Strategy dependent
Best Markets
Any OHLC market
SMI Pine Script Code Example
The code below plots the SMI using a custom p_ta_smi() function in Pine Script v6, with a centered oscillator range of -100 to +100 and an EMA signal line. To add it to TradingView, open the Pine Script editor with Alt+P, paste the code, and click Add to chart. The SMI will appear as a blue line in a separate pane beneath the price chart, with an orange signal line and blue horizontal boundaries at +40 and -40. You can adjust the three parameters (K Length, D Length, EMA Length) in the indicator settings panel. Increasing the K Length smooths the line but adds lag.
//@version=6
indicator(title="Stochastic Momentum Index (SMI)", overlay=false, max_labels_count=500)

// Double EMA helper
p_ta_emaEma(source, length) => ta.ema(ta.ema(source, length), length)

// SMI Calculation
p_ta_smi(simple int k_length, simple int d_length, simple int ema_length) =>
    highest_high = ta.highest(k_length)
    lowest_low = ta.lowest(k_length)
    highest_lowest_range = highest_high - lowest_low
    relativeRange = close - (highest_high + lowest_low) / 2
    smi = 200 * (p_ta_emaEma(relativeRange, d_length) / p_ta_emaEma(highest_lowest_range, d_length))
    smi_ema = ta.ema(smi, ema_length)
    [smi, smi_ema]

// Apply with default params
[p_ind_1_smi, p_ind_1_smiEma] = p_ta_smi(10, 3, 3)

// SMI Line
plot(p_ind_1_smi, "SMI", color.rgb(41, 98, 255, 0), 1)
// Signal Line
plot(p_ind_1_smiEma, "SMI - EMA", color.rgb(255, 109, 0, 0), 1)

// Overbought / Oversold / Middle Levels
p_ind_1_smi_overbought = hline(40, "SMI - Overbought Line")
p_ind_1_smi_oversold   = hline(-40, "SMI - Oversold Line")
hline(0, "SMI - Middle Line", color = color.new(color.gray, 50))

// Background Fill
fill(p_ind_1_smi_overbought, p_ind_1_smi_oversold, color=color.rgb(33, 150, 243, 90), title="SMI - Background")
Chart Preview
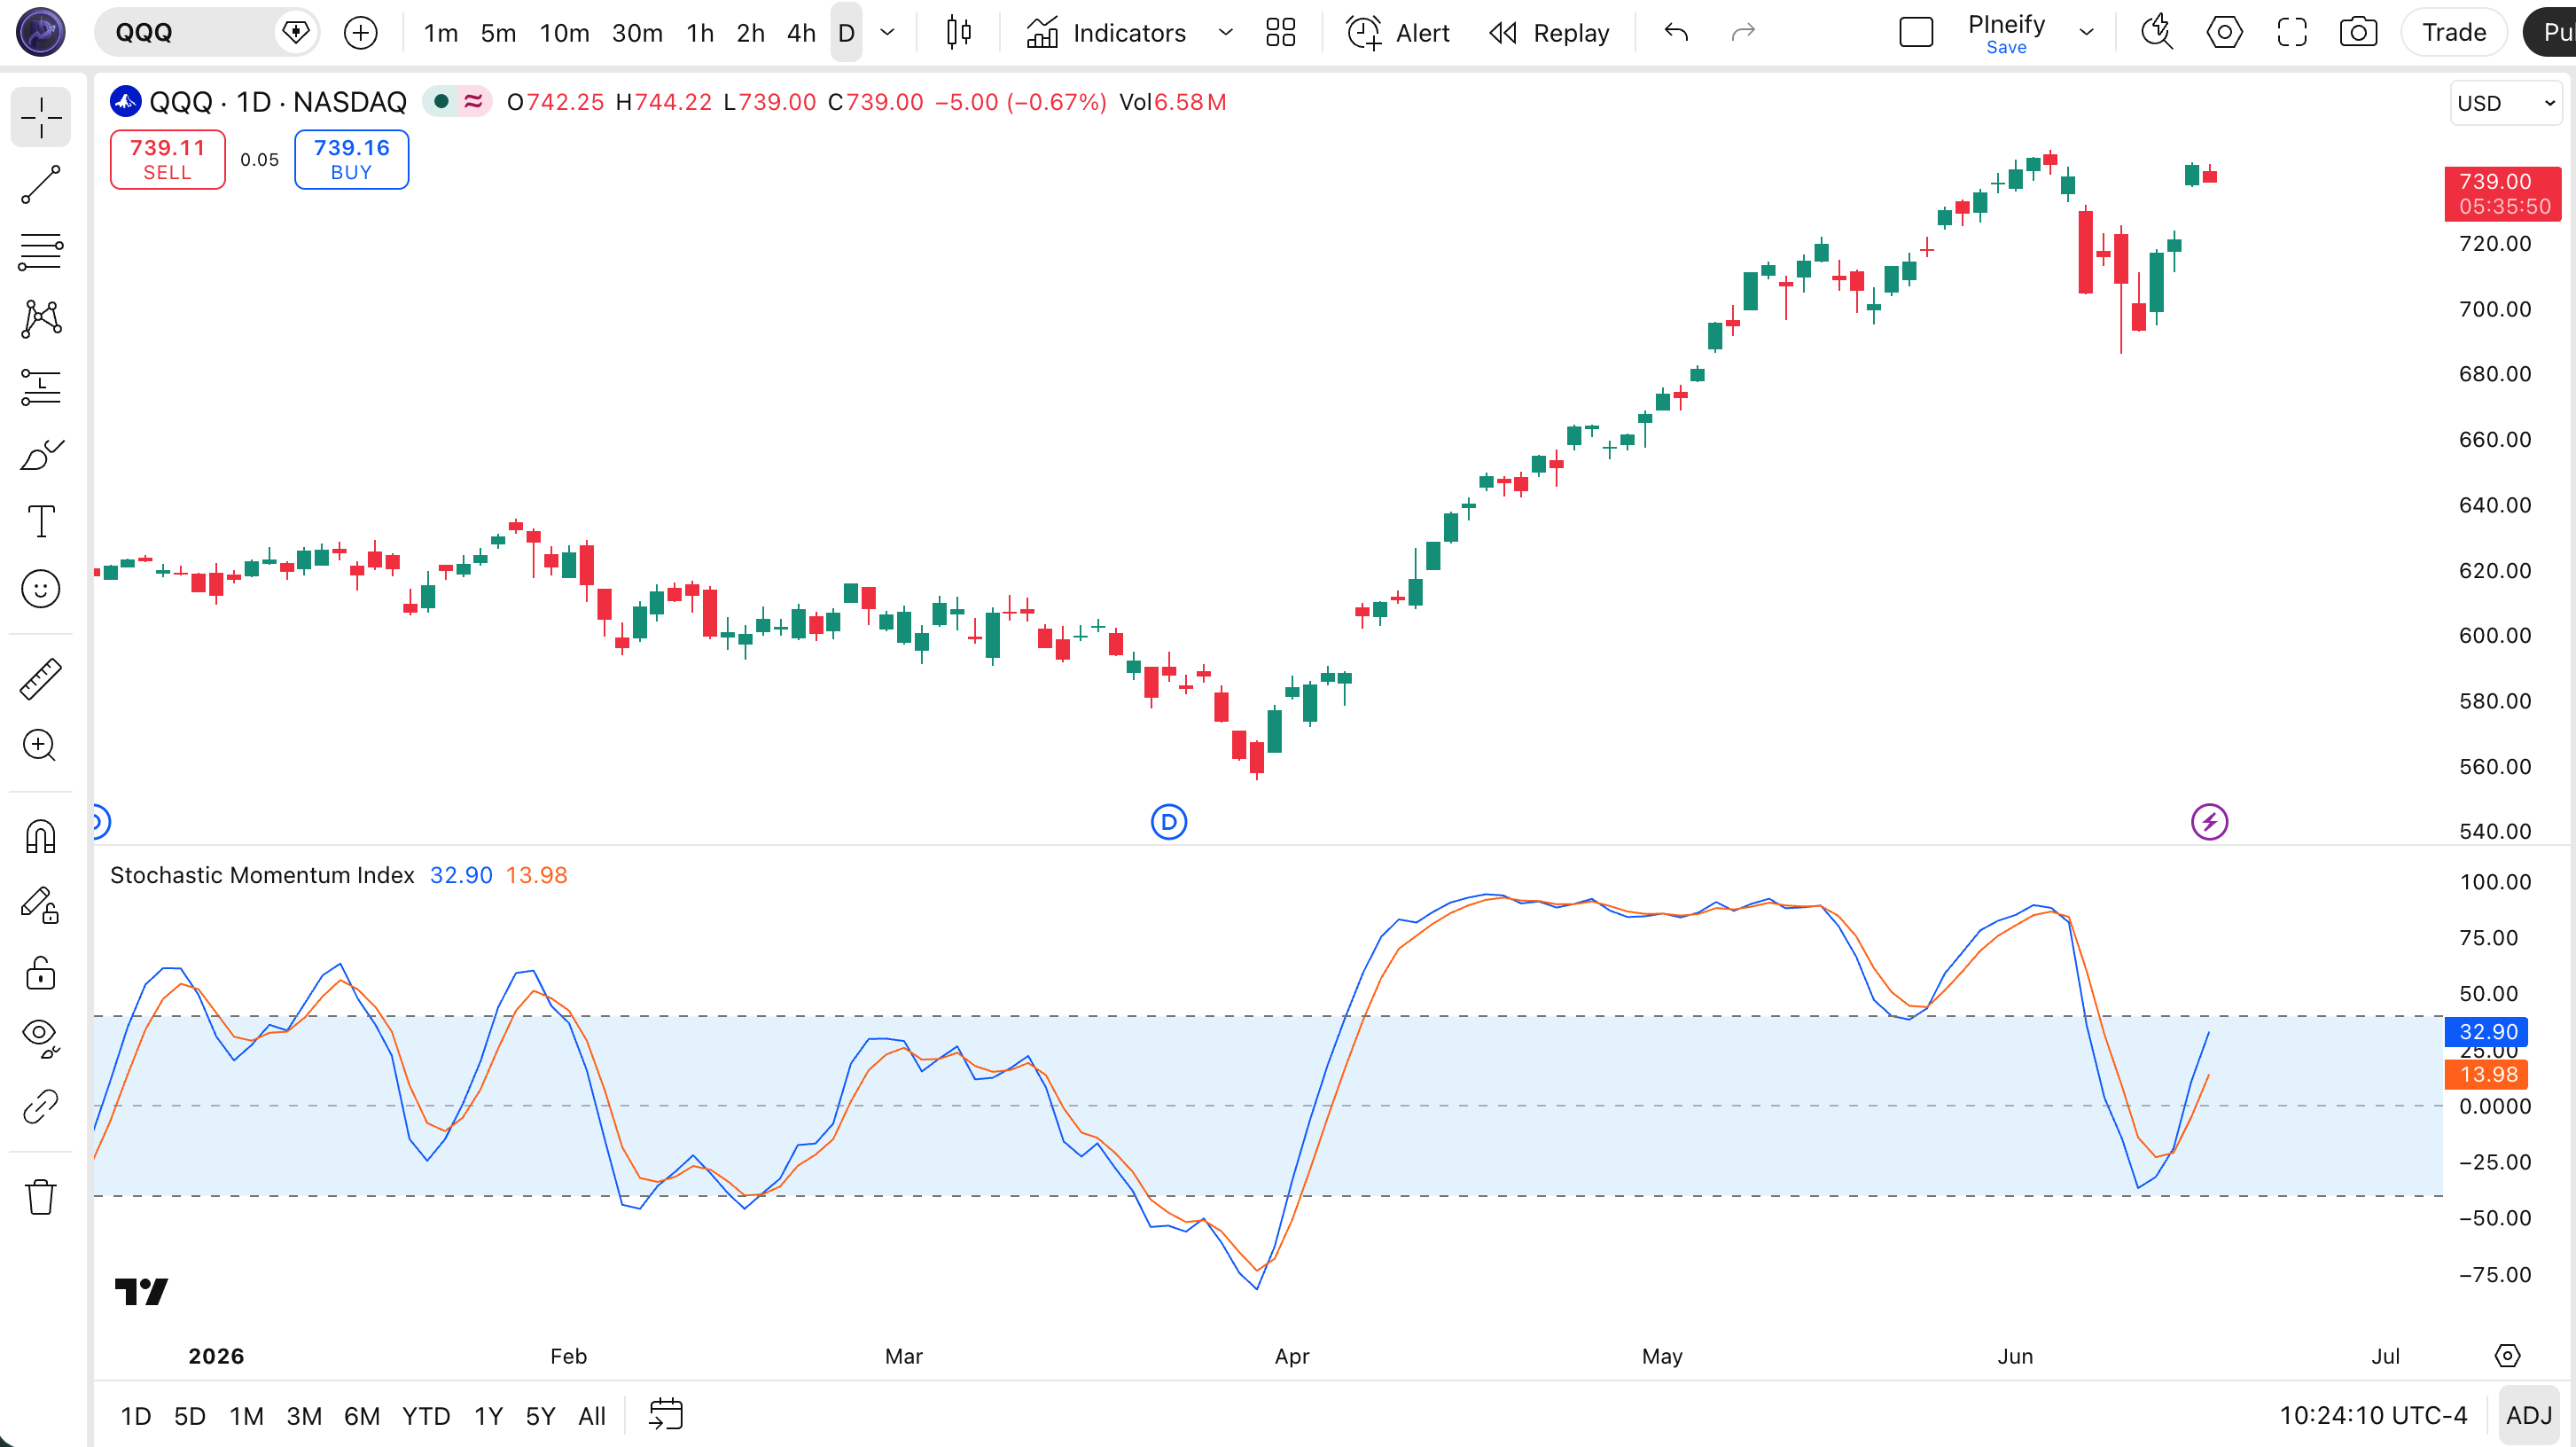
Chart Annotation Guide
| Element | Description |
|---|---|
| SMI line (blue) | The primary oscillator line: measures where close sits relative to the midpoint, double-smoothed over D periods |
| Signal line (orange) | The EMA of the SMI. Its crossover with the blue SMI line generates the main entry/exit signals |
| Overbought line (+40) | The upper threshold: SMI above +40 suggests extended bullish momentum and potential reversal zone |
| Oversold line (-40) | The lower threshold: SMI below -40 signals excess selling pressure and a potential bounce area |
| Centerline (0) | The directional split: above 0 means close is above the range midpoint; below 0 means close is below it |
| Blue fill (+40 to -40) | The normal trading zone: SMI oscillating in this band indicates no extreme momentum bias |
SMI Parameters
| Parameter | Default Value | Description | Recommended Range |
|---|---|---|---|
| K Length | 10 | The lookback period for finding the highest high and lowest low. Controls how far back the SMI looks to establish the trading range. A smaller K reacts faster but produces more noise. | Start with 7 to 14, then test |
| D Length | 3 | The smoothing period for the double EMA applied to both the relative range and the range width. This is the primary smoothing factor. Higher values make the SMI smoother and slower. | Start with 2 to 7, then test |
| EMA Length | 3 | The smoothing period for the SMI signal line. Controls how tightly the orange signal line tracks the blue SMI line. A shorter value produces faster signal crossovers. | Start with 2 to 7, then test |
Tuning Scenarios by Trading Style
| Scenario | K Length | D Length | EMA Length | Use Case |
|---|---|---|---|---|
| Scalping | 7 | 2 | 2 | A faster hypothesis for short intraday charts |
| Swing | 10 | 3 | 3 | The page baseline for comparing other settings |
| Position | 14 | 5 | 5 | A slower hypothesis for higher timeframes |
K Length changes the range used by the SMI. Lower values react to a shorter price window. Higher values respond more slowly. When I test K=7, K=10, and K=14, I keep D Length, EMA Length, the symbol, and the trade rules unchanged. That isolates the effect of K Length.
Reading the SMI Signals
The table separates level crosses, centerline crosses, and divergence. None of them predicts the next bar. Read each event with the default K=10, D=3, EMA=3 settings, then define the confirmation your strategy requires.
| Signal | Condition | Meaning | Confirmation to check |
|---|---|---|---|
| Bullish Oversold | SMI crosses above -40 | The close is moving back toward the range midpoint | Trend and price structure |
| Bearish Overbought | SMI crosses below +40 | The close is moving back toward the range midpoint | Trend and price structure |
| Centerline Bullish | SMI crosses above 0 | Close has moved above the range midpoint, so momentum is shifting from bearish to bullish | Close above the midpoint |
| Centerline Bearish | SMI crosses below 0 | Close has dropped below the range midpoint, so bearish momentum gaining control | Close below the midpoint |
| Bullish Divergence | Price lower low, SMI higher low | Downward momentum has weakened relative to price | A price reversal trigger |
| Bearish Divergence | Price higher high, SMI lower high | Upward momentum has weakened relative to price | A price reversal trigger |
Common misinterpretation: The SMI crossing above -40 is not a guaranteed buy signal. In a strong downtrend, the SMI can bounce above -40 briefly and then drop back below it. Use an explicit trend filter or price trigger, and verify that rule in a backtest before treating the cross as an entry.
SMI Trading Strategies
These examples turn SMI readings into explicit rules that can be coded and tested. They are starting points, not validated trading systems. The SMI reacts to historical price data and cannot predict the next move.
Strategy 1: Oversold Bounce with 200 EMA Filter
Hypothesis: trend-aligned pullback on Daily or 4H
This rule allows a long setup only when price is above its 200 EMA and the SMI moves back above -40. The EMA is a trend condition, not proof that the next trade will win.
- Calculate 200-period EMA:
ema200 = ta.ema(close, 200) - Calculate SMI using
p_ta_smi(10, 3, 3) - Long entry: close > ema200 AND SMI crosses above -40, so the trend and momentum conditions are both true
- Stop-loss: 1.5× ATR(14) below the lowest low of the oversold price swing
- Exit: SMI crosses below 0 OR signal line crosses below SMI line
Strategy 2: SMI Centerline Momentum Shift
Hypothesis: centerline continuation on 4H or Daily
When the SMI crosses above 0, the smoothed close has moved above the range midpoint. This example combines that event with a 50 EMA trend condition.
- Calculate SMI with
p_ta_smi(10, 3, 3) - Calculate trend filter:
ema50 = ta.ema(close, 50) - Long entry: close > ema50 AND ta.crossover(smi, 0)
- Short entry: close < ema50 AND ta.crossunder(smi, 0)
- Stop-loss: 1× ATR(14) below the entry bar's low (long) or above the entry bar's high (short)
- Exit: ta.crossunder(smi, 0) for longs or ta.crossover(smi, 0) for shorts
Test long and short rules separately. Include commission, slippage, position sizing, and an out-of-sample period.
Strategy 3: SMI Signal Line Crossover Reversal
Hypothesis: reversal after an extreme reading
The signal line crossover (orange line crossing the blue SMI line) at extreme levels can mark a loss of momentum. When both lines sit above +40 and the orange line crosses below the blue line, bullish momentum is fading. The reverse is true below -40. The divergence between the two lines is a condition to verify with price, not a forecast.
- Calculate SMI and signal line:
[smi, smiEma] = p_ta_smi(10, 3, 3) - Bearish signal line crossover: Both SMI and signal line are above +40, then signal line crosses below SMI
- Bullish signal line crossover: Both SMI and signal line are below -40, then signal line crosses above SMI
- Entry for bearish setup: Wait for SMI to cross below +40 as confirmation after the signal line crossover
- Entry for bullish setup: Wait for SMI to cross above -40 after the signal line crossover
- Stop-loss: 1× ATR(14) beyond the extreme price bar of the signal crossover (above for bearish, below for bullish)
- Exit: SMI crosses back to the opposite extreme level or signal line crosses back in the opposite direction
When I test this rule on ETHUSD, I record the exchange, session, timeframe, fees, and threshold values. Those inputs materially change the result.
| Strategy | Market Type | Confirmation | Risk control | Validation note |
|---|---|---|---|---|
| Oversold Bounce | Ranging | Price above 200 EMA | ATR-based stop | Test pullbacks and trends separately |
| Centerline Momentum | Trending | Close above or below EMA(50) | ATR-based stop | Measure lag and turnover |
| Signal Line Reversal | Trend Reversal | Price reversal trigger | ATR-based stop | Extremes can persist in a trend |
No performance result is implied. Run the complete rules on your own data before using them.
Disclaimer: The strategies above are for educational purposes only and do not constitute investment advice. Past performance does not guarantee future results. Always apply proper risk management and position sizing.
SMI vs Stochastic vs TSI
How does the Stochastic Momentum Index compare to other momentum oscillators? The two closest alternatives are the regular Stochastic oscillator (developed by George Lane) and the True Strength Index (TSI, also by William Blau). All three identify momentum shifts and overbought/oversold conditions, but their construction produces meaningfully different behavior. The table below breaks down the differences.
| Feature | SMI | Stochastic | TSI |
|---|---|---|---|
| Type | Momentum oscillator | Momentum oscillator | Momentum oscillator |
| Scale | -100 to +100 | 0 to 100 | Unbound |
| Reference point | Range midpoint | Lowest low | Price change (PC) |
| Smoothing | Double EMA | SMA (raw %K) | Double EMA |
| Lag level | Medium | Low | Medium |
| Typical use | Ranging, trending | Ranging | Trending, reversal |
| Main trade-off | More smoothing and lag | Faster response and more noise | Unbounded values need context |
Choose by calculation and test result. SMI uses a centered range and double EMA smoothing. The regular stochastic uses a 0 to 100 range and responds more directly to range position. Read the Stochastic Oscillator Pine Script guide for its formula and code.
TSI uses price change rather than range position, so its values answer a different question. If your strategy needs an overbought or oversold market scan, use the Stochastic Oscillator Screener. For a direct comparison of two common oscillators, read Stochastic vs RSI.
Common Mistakes When Using the SMI
1. Treating +40/-40 as hard reversal levels
The SMI above +40 means momentum is strong, not that the move is over. In a strong bull trend, the SMI can stay above +40 while price continues higher. Define a separate reversal condition before considering a short.
2. Using default thresholds on crypto
Do not assume that +40 and -40 fit BTCUSDT, ETHUSD, or SOLUSD because those levels appear in a default example. Test the thresholds on each pair, timeframe, and exchange data set.
3. Ignoring the centerline
The 0 level tells you whether the smoothed close is above or below the range midpoint. It does not identify a turning point by itself. Include it only when the centerline has a defined role in your strategy.
4. Using the SMI on low timeframes
Double smoothing adds lag. On lower timeframes, compare the timestamp of each SMI signal with the equivalent regular stochastic signal. The strategy should account for any delay before you evaluate performance.
5. Trading SMI without a volume check
The SMI uses high, low, and close data. It does not include volume. A volume filter such as volume above its 20-period average creates a new strategy rule, so test the filtered and unfiltered versions separately.
How to Generate the SMI Indicator in Pineify
- 1
Open Pineify
Open Pineify and sign in. Start a new Pine Script indicator so you can inspect and edit the generated code.
- 2
Click "New Indicator"
Select "Indicator" from the Pineify dashboard creation menu. You can then describe the exact SMI setup you want, including custom K, D, and EMA length values.
- 3
Describe the SMI configuration you need
Type a prompt such as: "Plot the SMI oscillator with K=10, D=3, EMA=3 and mark overbought at +40 and oversold at -40." Review the generated Pine Script v6 before using it.
- 4
Copy to TradingView
Copy the generated code. Open TradingView, launch the Pine Editor, paste the code, save it, and click "Add to chart." Confirm that the plots and inputs match the prompt.
- 5
Adjust the K, D, and EMA parameters
Open the TradingView settings panel and compare one parameter change at a time. Keep the symbol, timeframe, and test rules fixed.
Frequently Asked Questions
Related Pine Script Indicators
Stochastic Oscillator
Compare the standard 0 to 100 stochastic calculation with the centered SMI formula
Schaff Trend Cycle
A fast-cycling trend-following oscillator that uses double smoothing to identify trend turns faster than MACD
True Strength Index
A double-smoothed momentum oscillator by William Blau that measures price change acceleration and deceleration
Relative Strength Index
A classic momentum oscillator on a 0-100 scale that measures the magnitude of recent price changes for overbought/oversold detection
MACD
A trend-following momentum indicator that shows the relationship between two moving averages of price
Money Flow Index
A volume-weighted momentum oscillator that combines price and volume data to measure buying and selling pressure
Build an SMI script you can inspect
Pineify generates editable Pine Script for custom K, D, and EMA lengths. Review the code, add it to TradingView, and backtest the complete rules before using them.
Try Pineify Free