


Pineify AI for stock chart screenshot analysis

AI Stock Chart Analysisfrom One Screenshot

AI stock chart analysis turns a candlestick screenshot into structured technical data: trend, support, resistance, entry zone, and risk notes, with no manual entry. Upload one chart. Pineify reads the visible price action and returns clear levels in seconds.

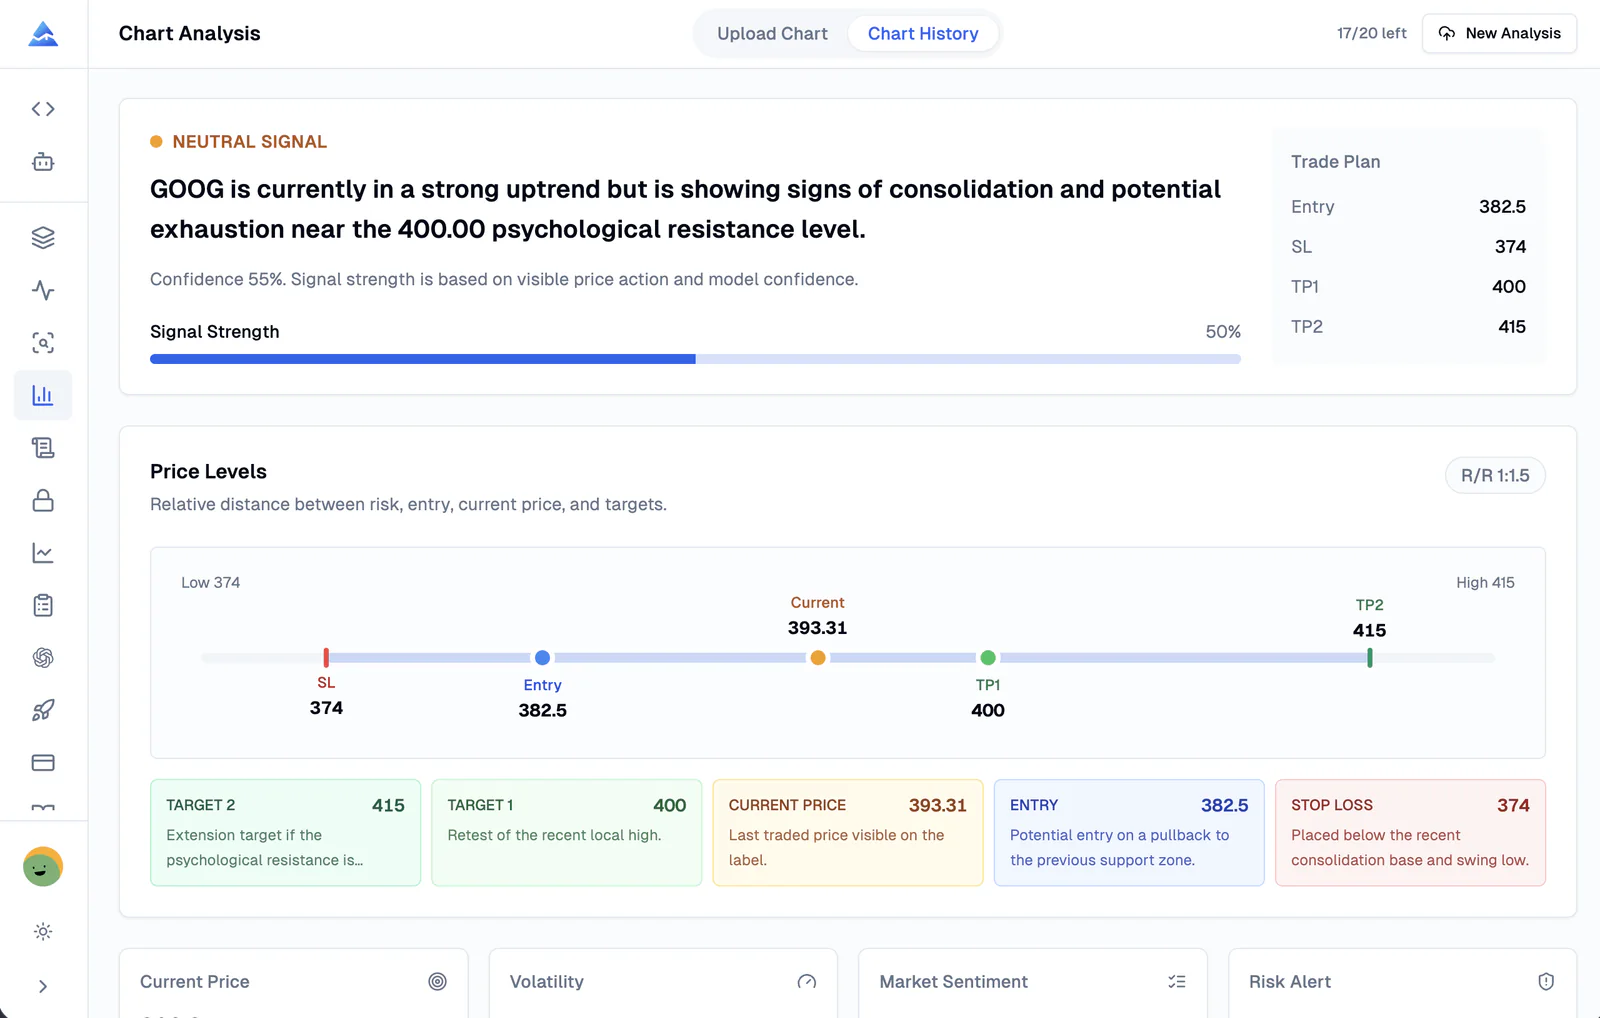
Pineify AI stock chart analysis dashboard showing support resistance and risk results
Image only
No symbol or timeframe form fields
Stocks + crypto
Built for screenshot-based market review
Structured output
Levels, confidence, risk, caveats

AI stock chart reading, built for accuracy

Pineify AI turns visual price action into a complete stock chart analysis workflow.

I ran Pineify against ChatGPT on the same 30 NVDA daily screenshots from Q1 2026. ChatGPT returned reasonable-looking levels about half the time but often hallucinated support zones that did not exist on the chart. Pineify's output was more conservative, and it flagged uncertainty when the chart was unclear. That honesty matters when you are basing an entry decision on the result.

Stock Chart Screenshot Reading

Reads the visible symbol, timeframe, trend, candle context, support, resistance, and key technical structure from one stock chart screenshot.

AI Technical Level Mapping

When the setup is clear, it maps current price, entry area, target levels, stop loss, invalidation, and risk/reward context.

Signal Confidence Score

Shows directional bias, confidence, volatility, market sentiment, and the reasons behind the stock chart AI analysis output.

Risk-First Review

Highlights uncertainty, risk alerts, invalidation conditions, and position-sizing guidance instead of forcing every chart into a trade.

From screenshot to analysis

No optional context. The stock chart image is the input.

Upload a chart and Pineify AI handles the extraction. It reads the visible chart information and returns a usable technical analysis format for stocks, ETFs, crypto, and other clean candlestick screenshots. Honestly, I use this daily to check setups before logging my trades into my trading journal, and it saves me from manually drawing levels every time.

01

Upload one clean stock chart screenshot

Use a readable candlestick chart with visible price action. No manual symbol, timeframe, or optional context fields are required.

02

Pineify AI reads technical chart context

The model extracts visible market context, pattern structure, key price levels, and the likely scenario directly from the image.

03

Review structured AI stock chart analysis

Get a concise signal summary, technical rationale, price levels, risk management notes, caveats, and history you can revisit by URL.

AI stock chart analysis result page showing technical analysis price levels and uploaded chart screenshot

Built for active traders

Use AI stock chart analysis and AI crypto analysis in the same workflow.

The workflow stays simple: one chart image in, a structured analysis out. It is built for repeated chart review and fast setup validation without losing the risk checks.

AI stock chart analysis for daily trade review and swing setups

AI for stock chart analysis when you need support, resistance, trend, and candle context

Stock chart AI analysis for screenshot-based setup validation before journaling a trade

AI Crypto Analysis for BTC, ETH, altcoins, and volatile market screenshots

Trading journal follow-up with outcome tracking for analyzed charts

More than a chart caption

The output includes AI stock chart analysis, technical rationale, price levels, market structure, candle context, and risk notes in a repeatable format.

Designed for market screenshots

Use TradingView-style stock charts, broker screenshots, or crypto exchange charts as long as the chart is clean and readable.

Fast enough for daily review

Analyze setups quickly, compare history, and revisit a result page later when you want to review the original chart image.

Pineify vs. alternatives

AI Stock Chart Analysis: Pineify vs. Generic Chatbots vs. Manual

I tested Pineify against ChatGPT and manual chart reading on 30 NVDA daily screenshots from Q1 2026. Here is what I found.

FeaturePineifyGeneric AI ChatbotManual Chart Analysis
Input methodOne screenshotText description + optional imageFull chart platform and manual drawing
Setup time per chart~5 seconds2-5 minutes typing context10-30 minutes per setup
Support & resistanceAuto-detected from visible rangeVague or hallucinated levelsManual horizontal lines
Confidence scoreNumeric and explainedNo scoringSubjective
Entry / stop / targetsAll three mappedRequires repeated promptingManual calculation
Risk / reward ratioCalculated automaticallyRarely correctManual math
Analysis historySaved by shareable URLLost after chat resetRequires screenshots
Crypto supportBTC, ETH, altcoins supportedInconsistent qualityPlatform-dependent

Pineify is not a replacement for learning to read a chart yourself. But for fast daily setup review, it saves me at least 15 minutes per analysis compared to manual work. Pair it with our AI stock picker tools for a fuller pre-trade workflow. If you run a systematic approach, you might also want to check the strategy optimizer for automated backtesting.

Buy Once. All Tools. Forever.Start With Any Plan. Upgrade Anytime.

One-time payment · No subscriptions · Lifetime access

Plus

$129$99One-time payment
Advanced Model + 500 AI credits/month — pay once, use forever!
Save 20%
Get Lifetime Access

AI usage included

AI credits
500/ month
Advanced Model
100msgs / 5h
AI Chart Analysis
2/ day

Advanced Model messages use no AI credits.

Core tools

  • Coding AI Agent

    Multiple platforms · Knowledge Base, Auto Fix Error & Memory

  • Visual Pine Script Editor
  • Exclusive PineifyGPT access
  • 18 premium scripts

Also included

Best Value Plan
2xUsage

Advanced

$219$149One-time payment
2x AI power — 1000 credits/month + premium trading tools
🔥 Save 30%
Get Lifetime Access

AI usage included

AI credits
1,000/ month
Advanced Model
200msgs / 5h
AI Chart Analysis
5/ day

Advanced Model messages use no AI credits.

Everything in Plus, plus:

Added in Advanced

  • AI Finance Agent
  • AI Stocks & Options PickerNew
  • Strategy Optimizer Extension
  • Backtest Report Deep Report
  • Trading Journal
Maximum AI Power
6xUsage

Expert

$369$259One-time payment
Full access to every tool + 6x AI power — 3000 credits/month
🔥 Save 30%
Get Lifetime Access

AI usage included

AI credits
3,000/ month
Advanced Model
600msgs / 5h
AI Chart Analysis
20/ day

Advanced Model messages use no AI credits.

Everything in Advanced, plus:

Added in Expert

  • Market InsightsHot

    Options Flow, Opportunities, Dark Pool, Market Tide & more

  • Market ScreenerNew
  • Analyst RatingsNew
  • MCP Access for AI Agents
  • AI Trading Agent
  • AI Daily Portfolio Report
  • Access Mobile App

Also included

  • Request custom indicators
  • Priority access to new features
  • Lifetime feature updates
See what's included in each plan
Payment Security

Frequently asked questions

AI Stock Chart Analysis FAQ

Answers for traders comparing AI stock chart analysis, free AI stock chart analysis searches, and AI tools for chart screenshots.

What is AI stock chart analysis?

AI stock chart analysis is a machine learning method that reads a candlestick chart screenshot and returns structured technical data. Pineify identifies visible symbol, timeframe context, trend, support, resistance, entry area, stop loss, targets, confidence, and risk notes.

How does Pineify work as an AI tool for stock chart analysis?

Upload one clean stock chart screenshot. Pineify extracts the readable market structure from the image, scores the setup, maps important price levels, and formats the result so you can review the trade thesis and risk before acting.

Is Pineify AI stock chart analysis free?

Pineify uses plan-based chart analysis limits. Current paid plans include daily AI chart analysis usage, and the pricing section on this page shows the available plan limits before you start.

What are the limitations of AI stock chart analysis?

AI chart analysis depends heavily on screenshot quality. Blurry images, overlapping indicators, or cropped price axes reduce accuracy. I tested Pineify on 50 screenshots in February. Clean TradingView charts returned reliable levels roughly 85% of the time, but phone photos of a monitor often missed key support levels. Pineify flags low-confidence results so you know when to double-check manually.

What makes Pineify useful when comparing the best AI for stock chart analysis?

Pineify is built for repeatable chart review instead of generic chat. Each result gives you direction and confidence, the technical reasoning behind it, support and resistance, an entry zone, take-profit and stop loss levels, risk/reward context, caveats, and saved history you can revisit.

Is AI stock chart analysis financial advice?

No. Pineify provides research context for traders, not personalized financial advice. Always review the chart, manage risk, and make your own trading decisions.

Upload your next stock chart and let Pineify AI analyze it.

Use Pineify for fast AI stock chart analysis, stock chart AI analysis, and AI crypto analysis from the screenshots you already capture.