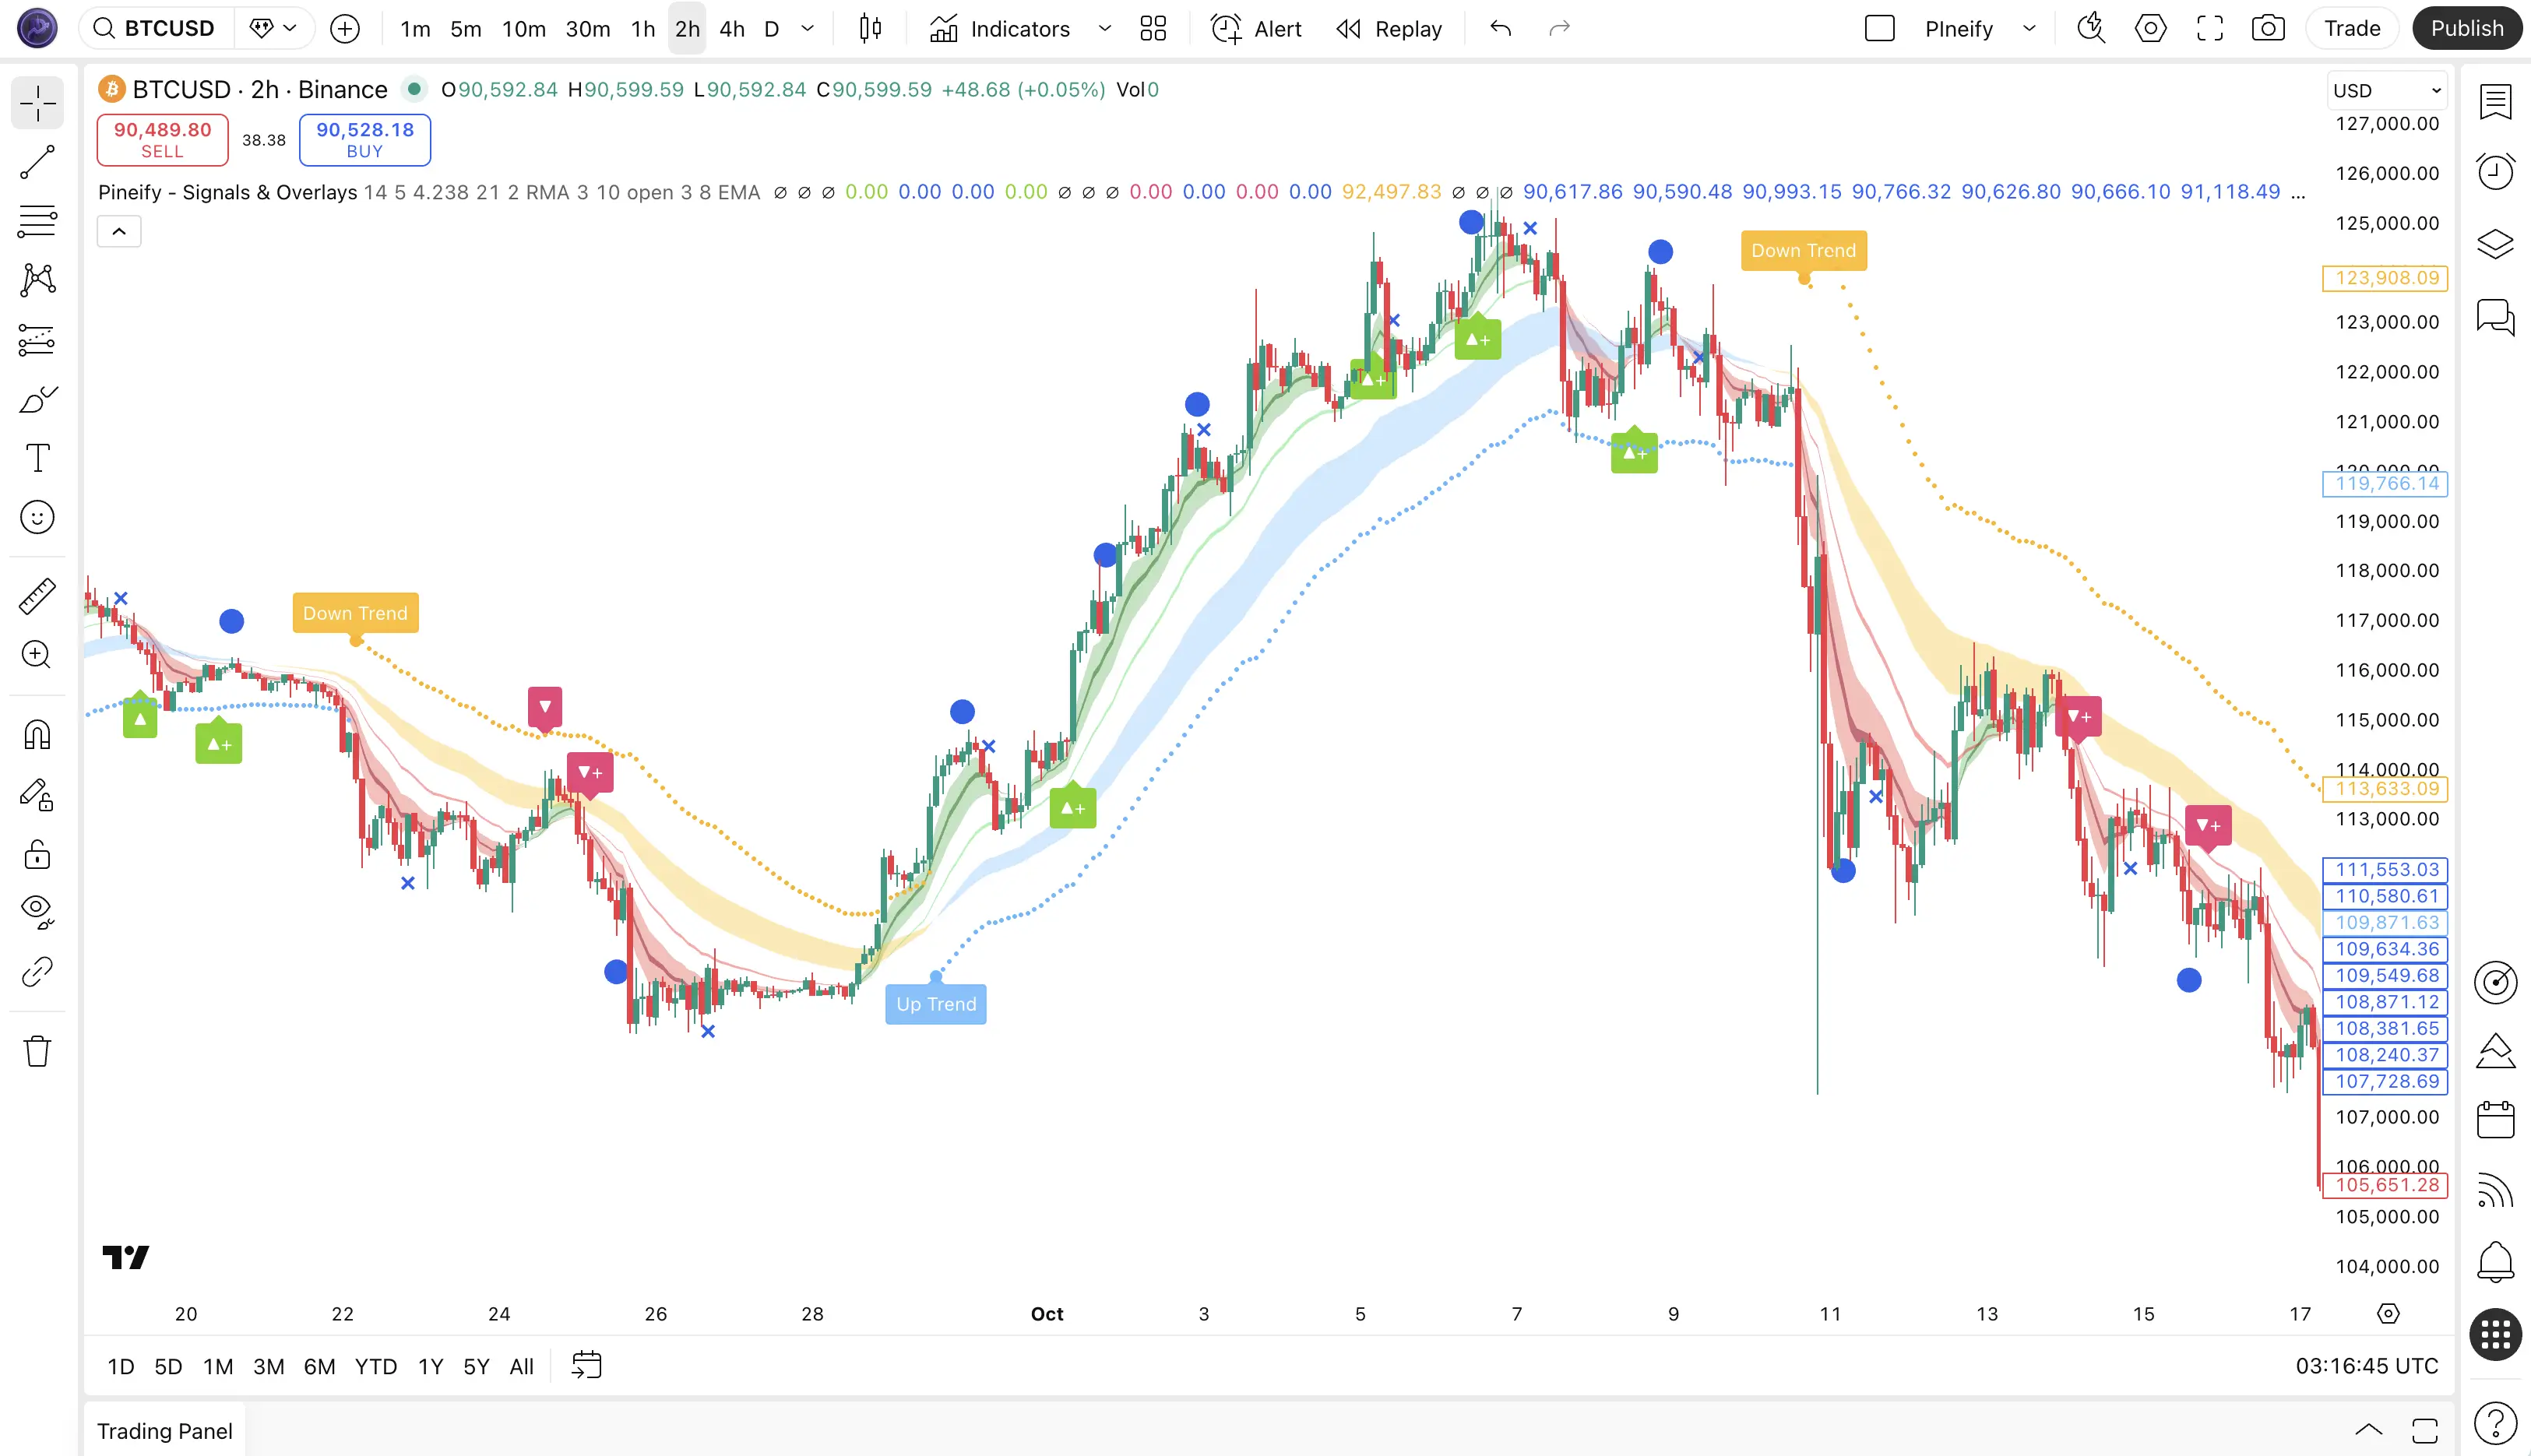
A TradingView indicator comparison like this one weighs signal accuracy, customization depth, and pricing against how you actually trade. LuxAlgo Signals & Overlays and Pineify Signals & Overlays are both premium all-in-one toolkits that bundle multiple analytical methods into a single chart overlay. Here's my verdict: if you swing-trade and want clean signals fast, Pineify's unified scoring beats LuxAlgo's 20-feature toolbox. But LuxAlgo's depth wins for day traders who fine-tune every parameter on ES futures. I've used both on my AAPL and BTCUSD charts over the past six months, so I'll tell you exactly what I found.
Whether you're juggling multiple prop firm accounts or just tired of entering the same trade on every platform, a TradingView trade copier saves hours each week. I'd pick a local copier for funded accounts, but the right tool depends on your brokers and what you're willing to risk.
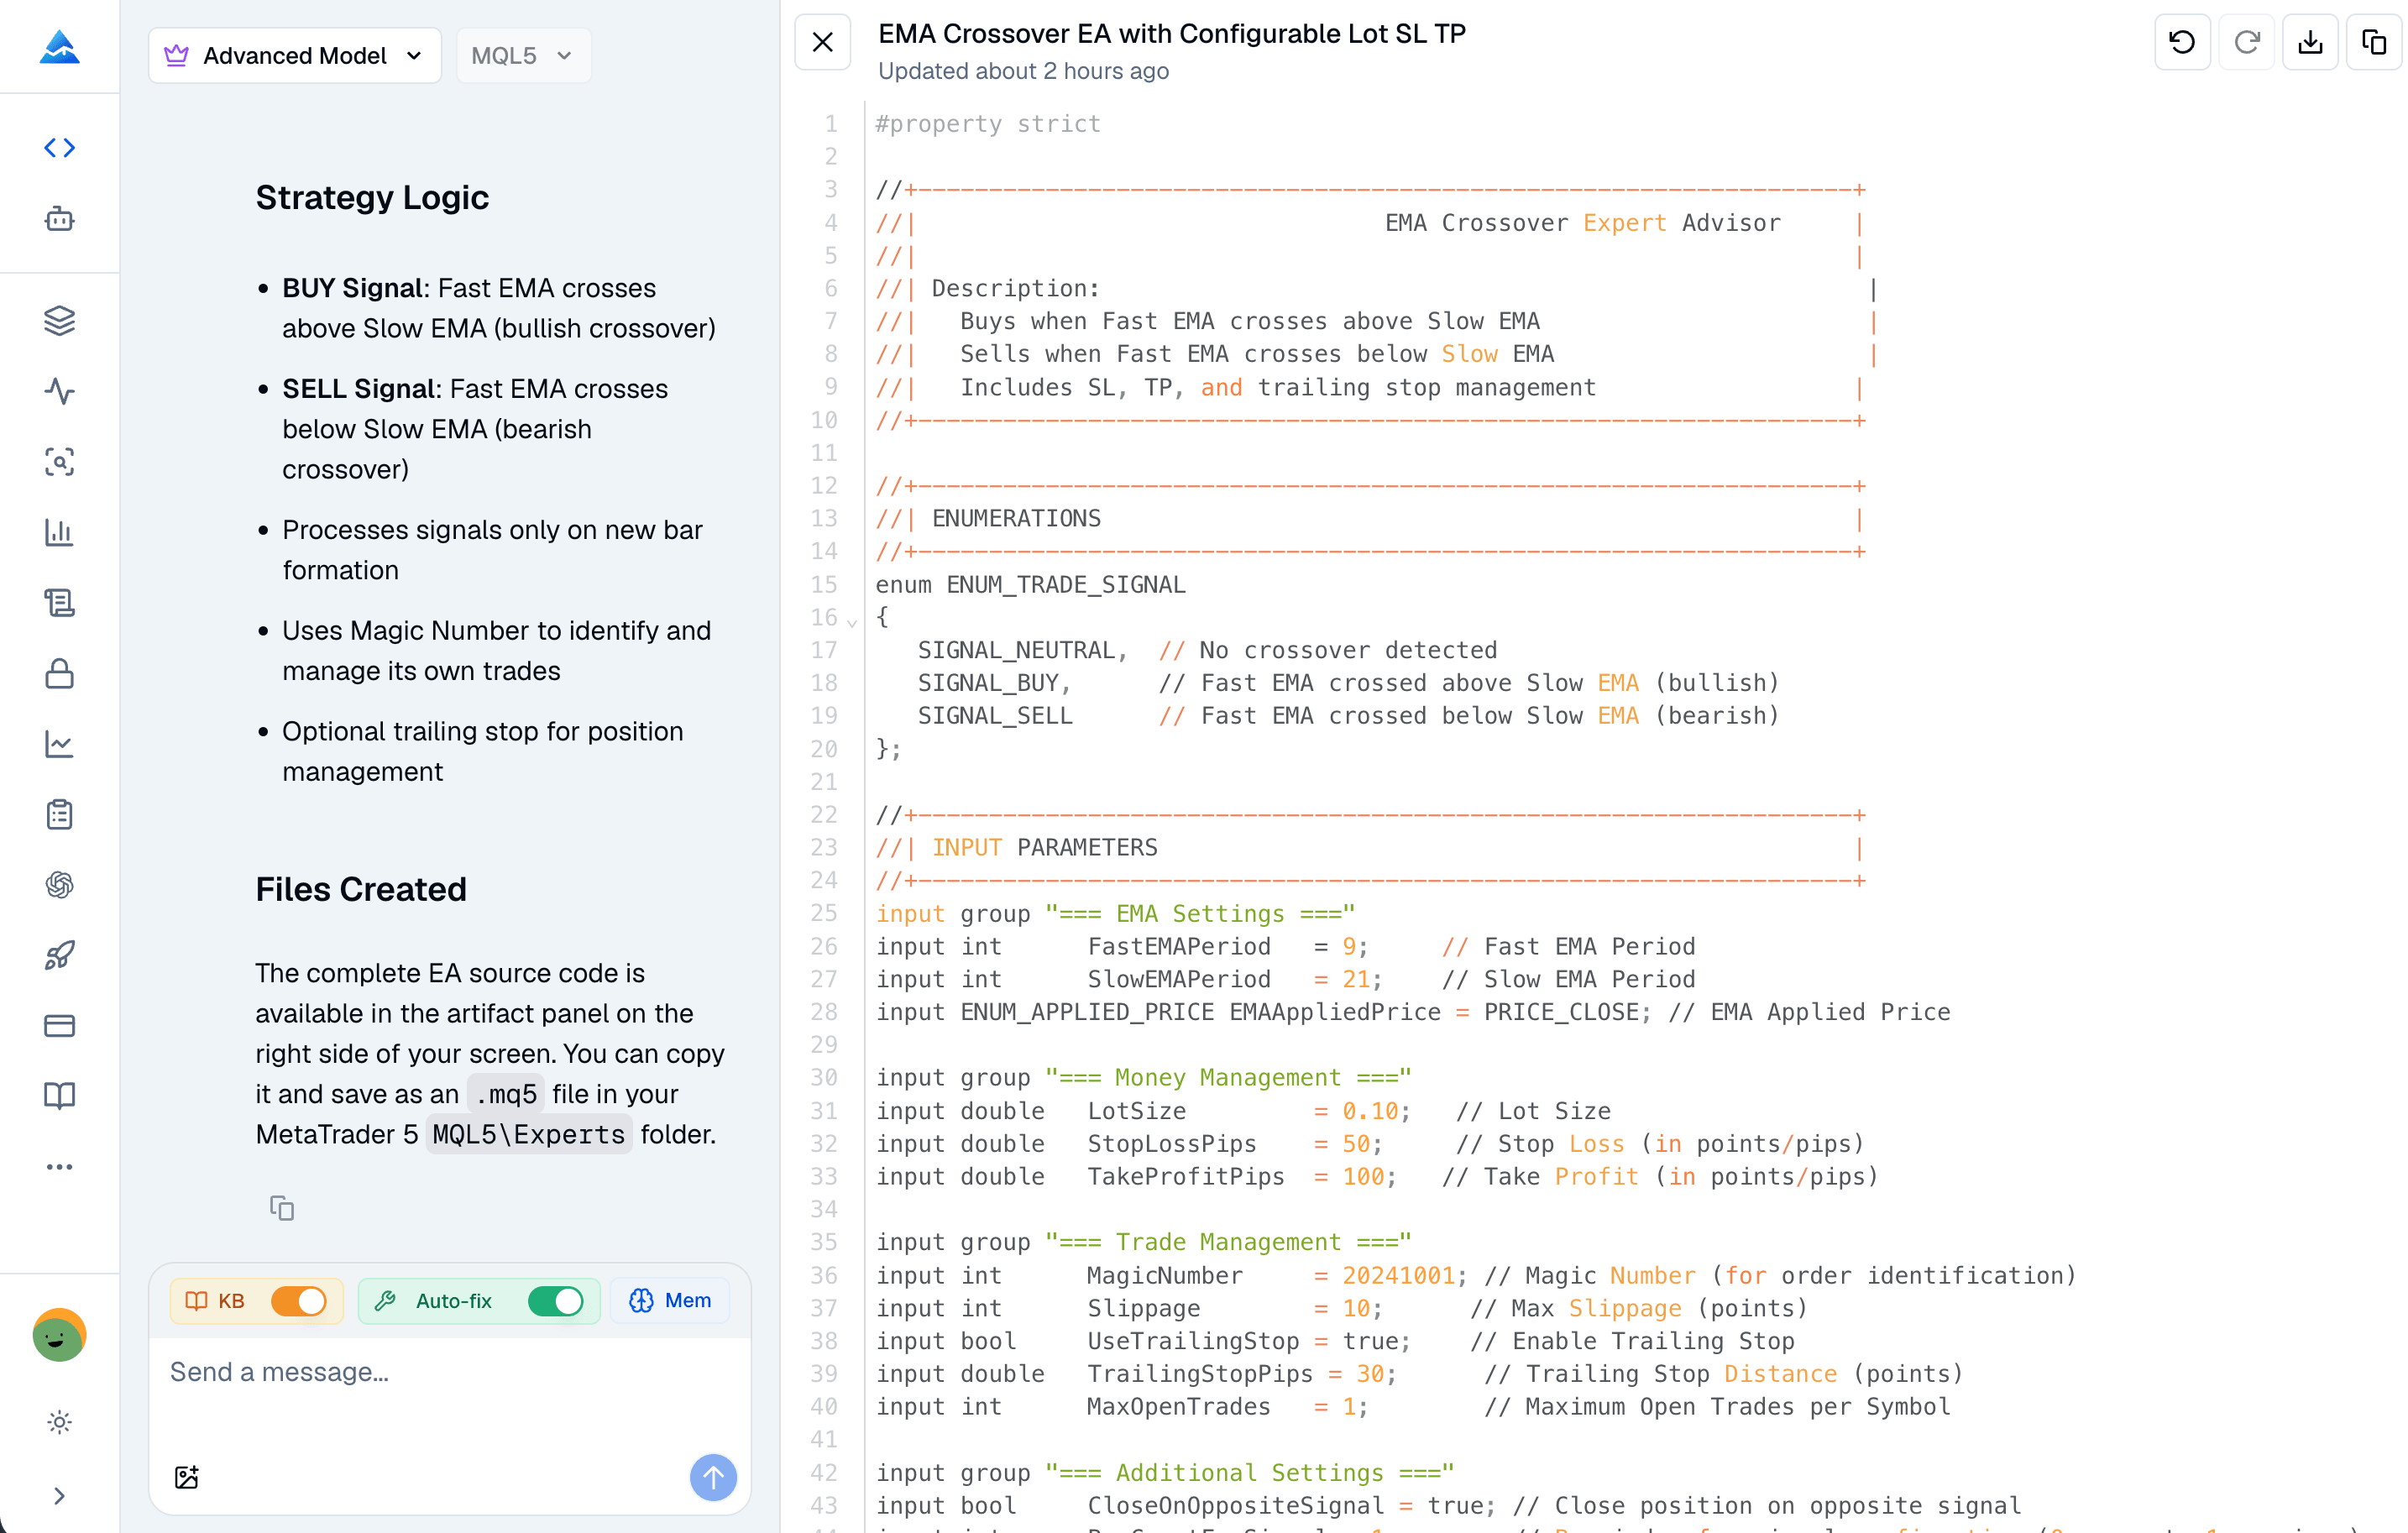
Your EA runs fine for three weeks. Then one Monday, without warning, it opens 47 EURUSD positions in six seconds. The broker blocks your account before you even get the email. That's not bad luck — it's unconditioned OnTick() logic. MQL5 coding best practices are the patterns and conventions that keep your Expert Advisors safe, readable, and maintainable in live MT5 environments. Clean syntax, solid error handling, defensive checks — those are what separate reliable EAs from ones that quietly lose money.
Whether you're a seasoned forex trader or just getting started with algorithmic trading, picking the best MT5 indicator separates consistent profits from costly guesswork. An MT5 indicator is a technical analysis tool that runs inside MetaTrader 5 to process price data and generate trade signals automatically. I've tested over a dozen on EUR/USD and XAU/USD this year, and most fall short on repainting or alert reliability. My verdict: PipTrend and Trend Screener Pro MT5 deliver the best balance of accuracy and usability for most traders right now.
Many traders treat a backtest as the final step — you see a green number and move on. But standard backtest outputs hide as much as they reveal. A Backtest Deep Report transforms raw trade data from TradingView's Strategy Tester into a multi-dimensional performance analysis. It goes beyond basic net profit and win rate to show risk-adjusted returns, time-dependent performance shifts, and worst-case scenarios.
Pineify's Backtest Deep Report fills in those gaps. It turns basic results into a detailed performance review that helps you separate strategies that are genuinely solid from those that happened to work during favorable market conditions.
You know that frustrating moment when you're staring at a single moving average, trying to figure out if the trend has enough strength to risk your money on? I've been there. Most indicators hand you one line and expect you to make confident trading decisions from it.
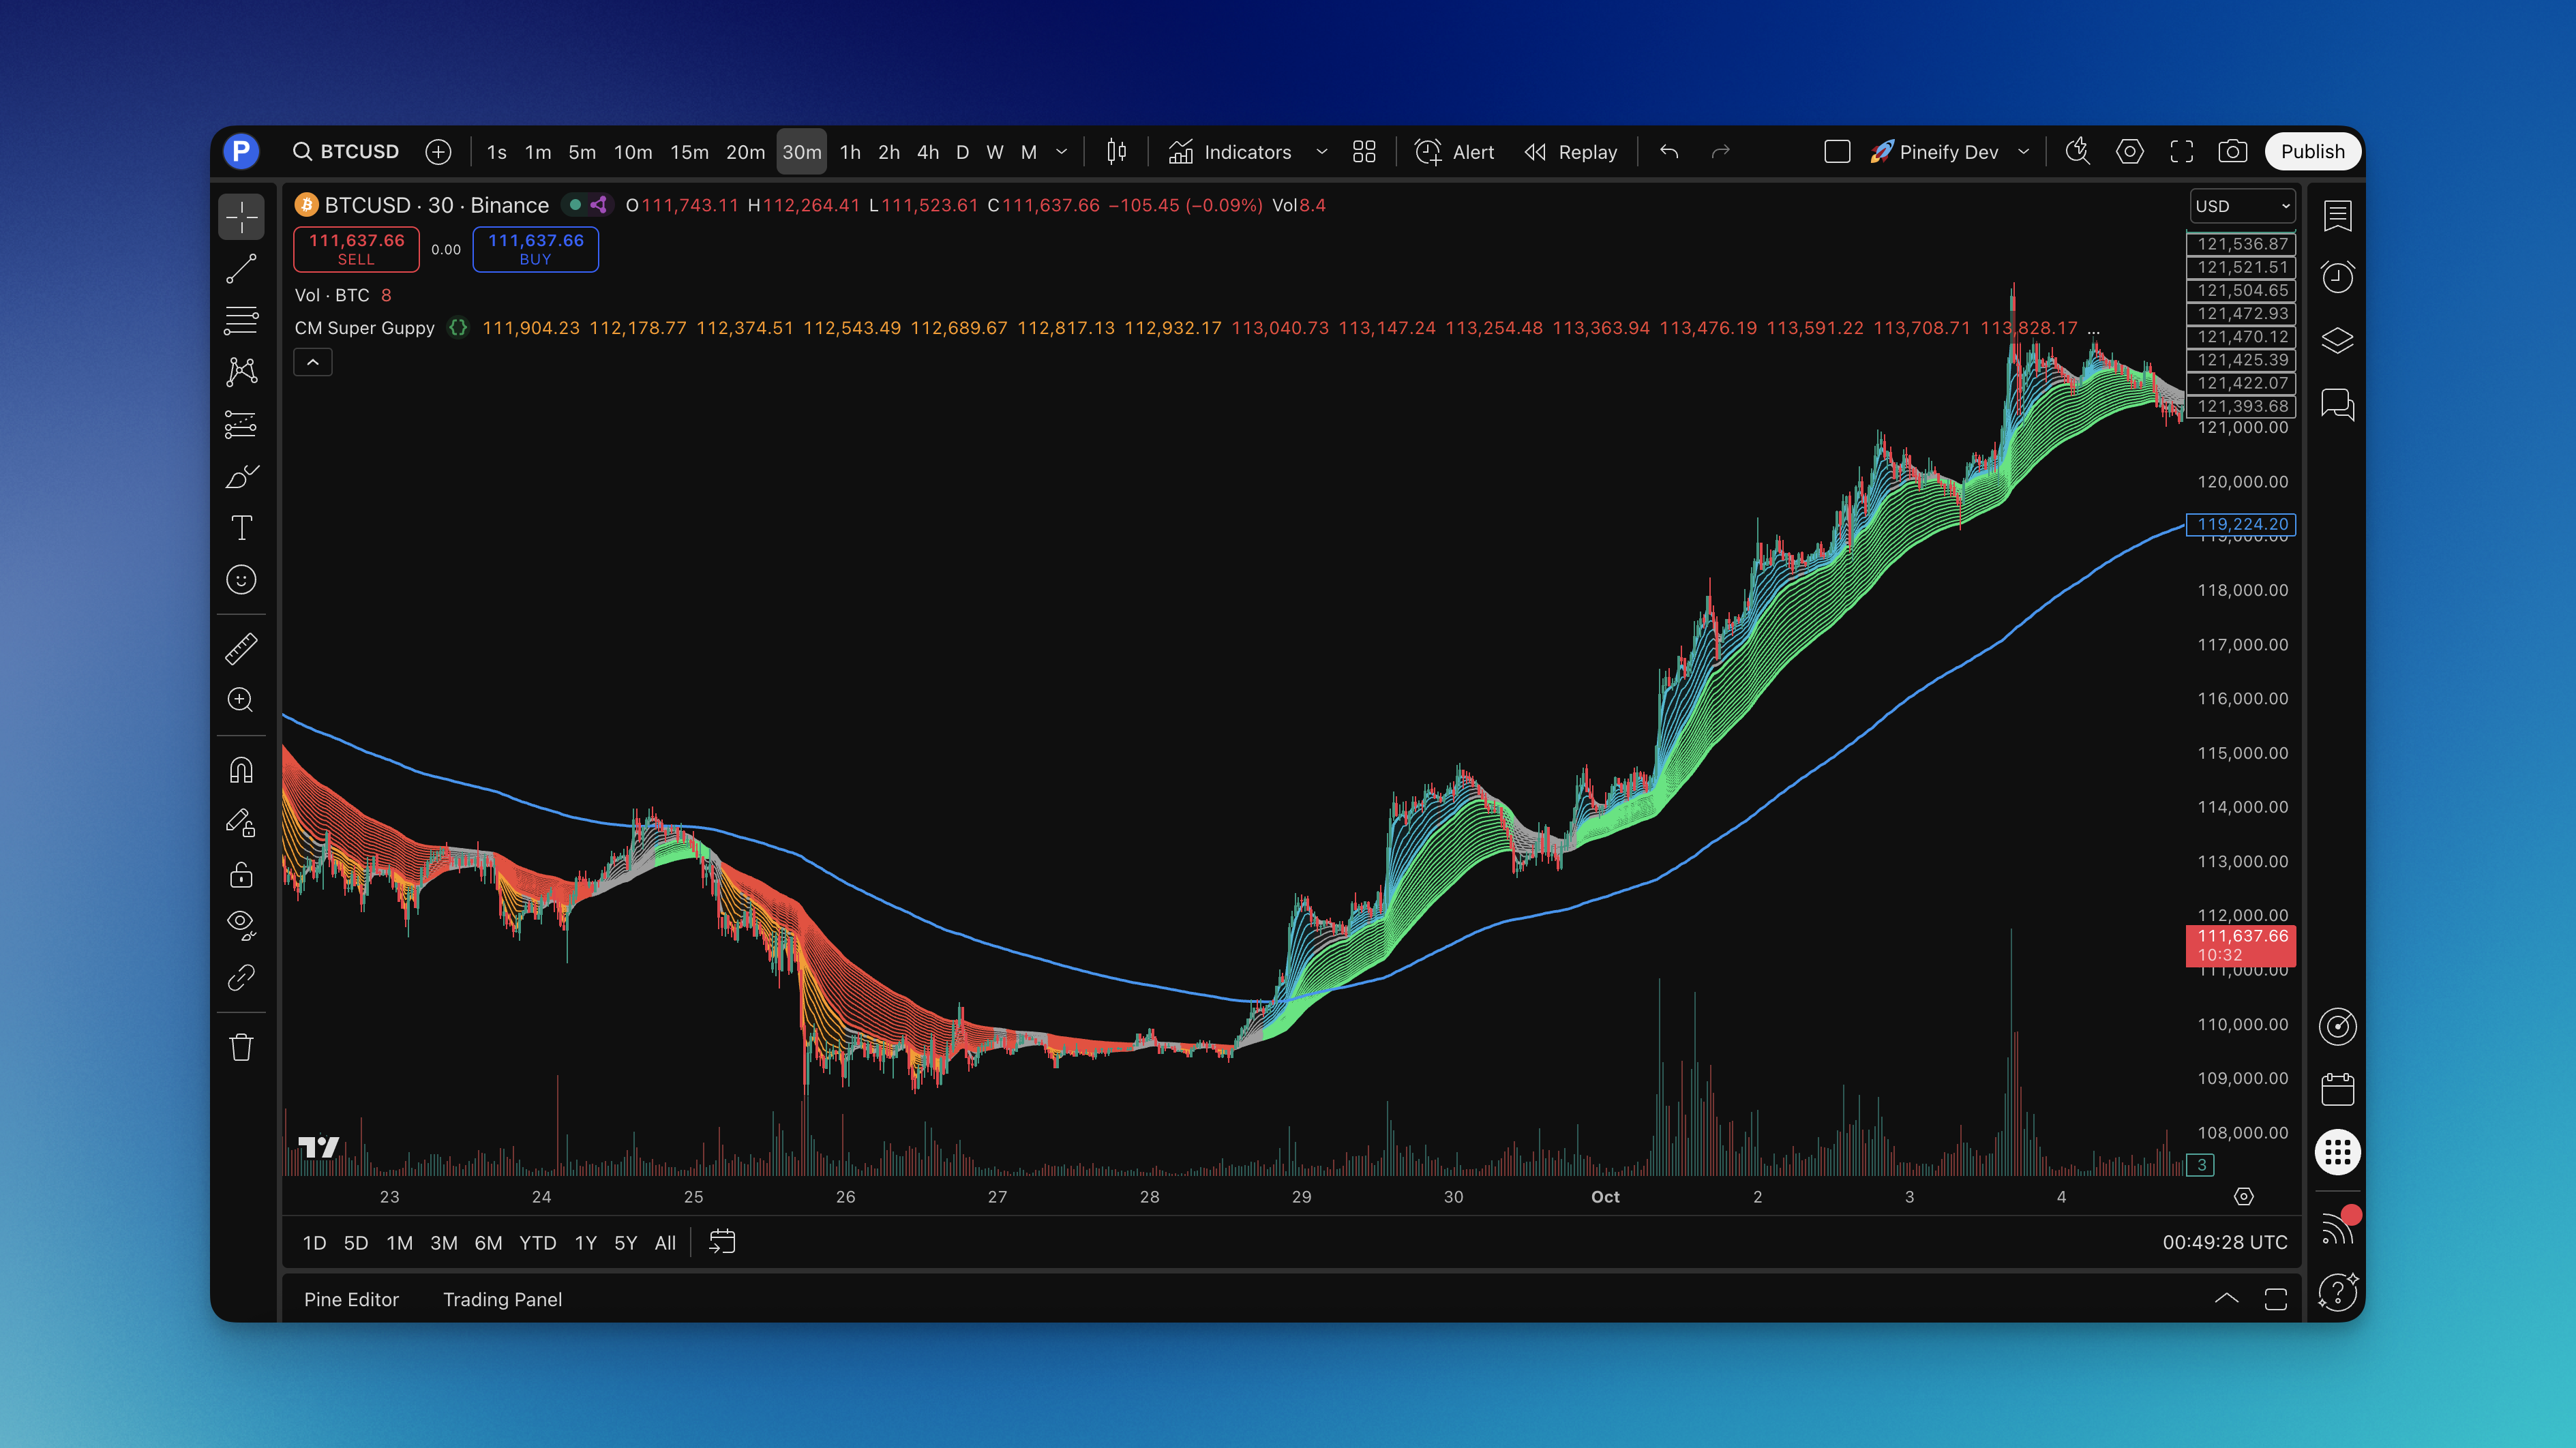
The CM Super Guppy is a trend analysis indicator that uses 23 exponential moving averages arranged into color-coded ribbons. It shows trend direction, momentum strength, and when different timeframes agree or disagree -- all at a glance.
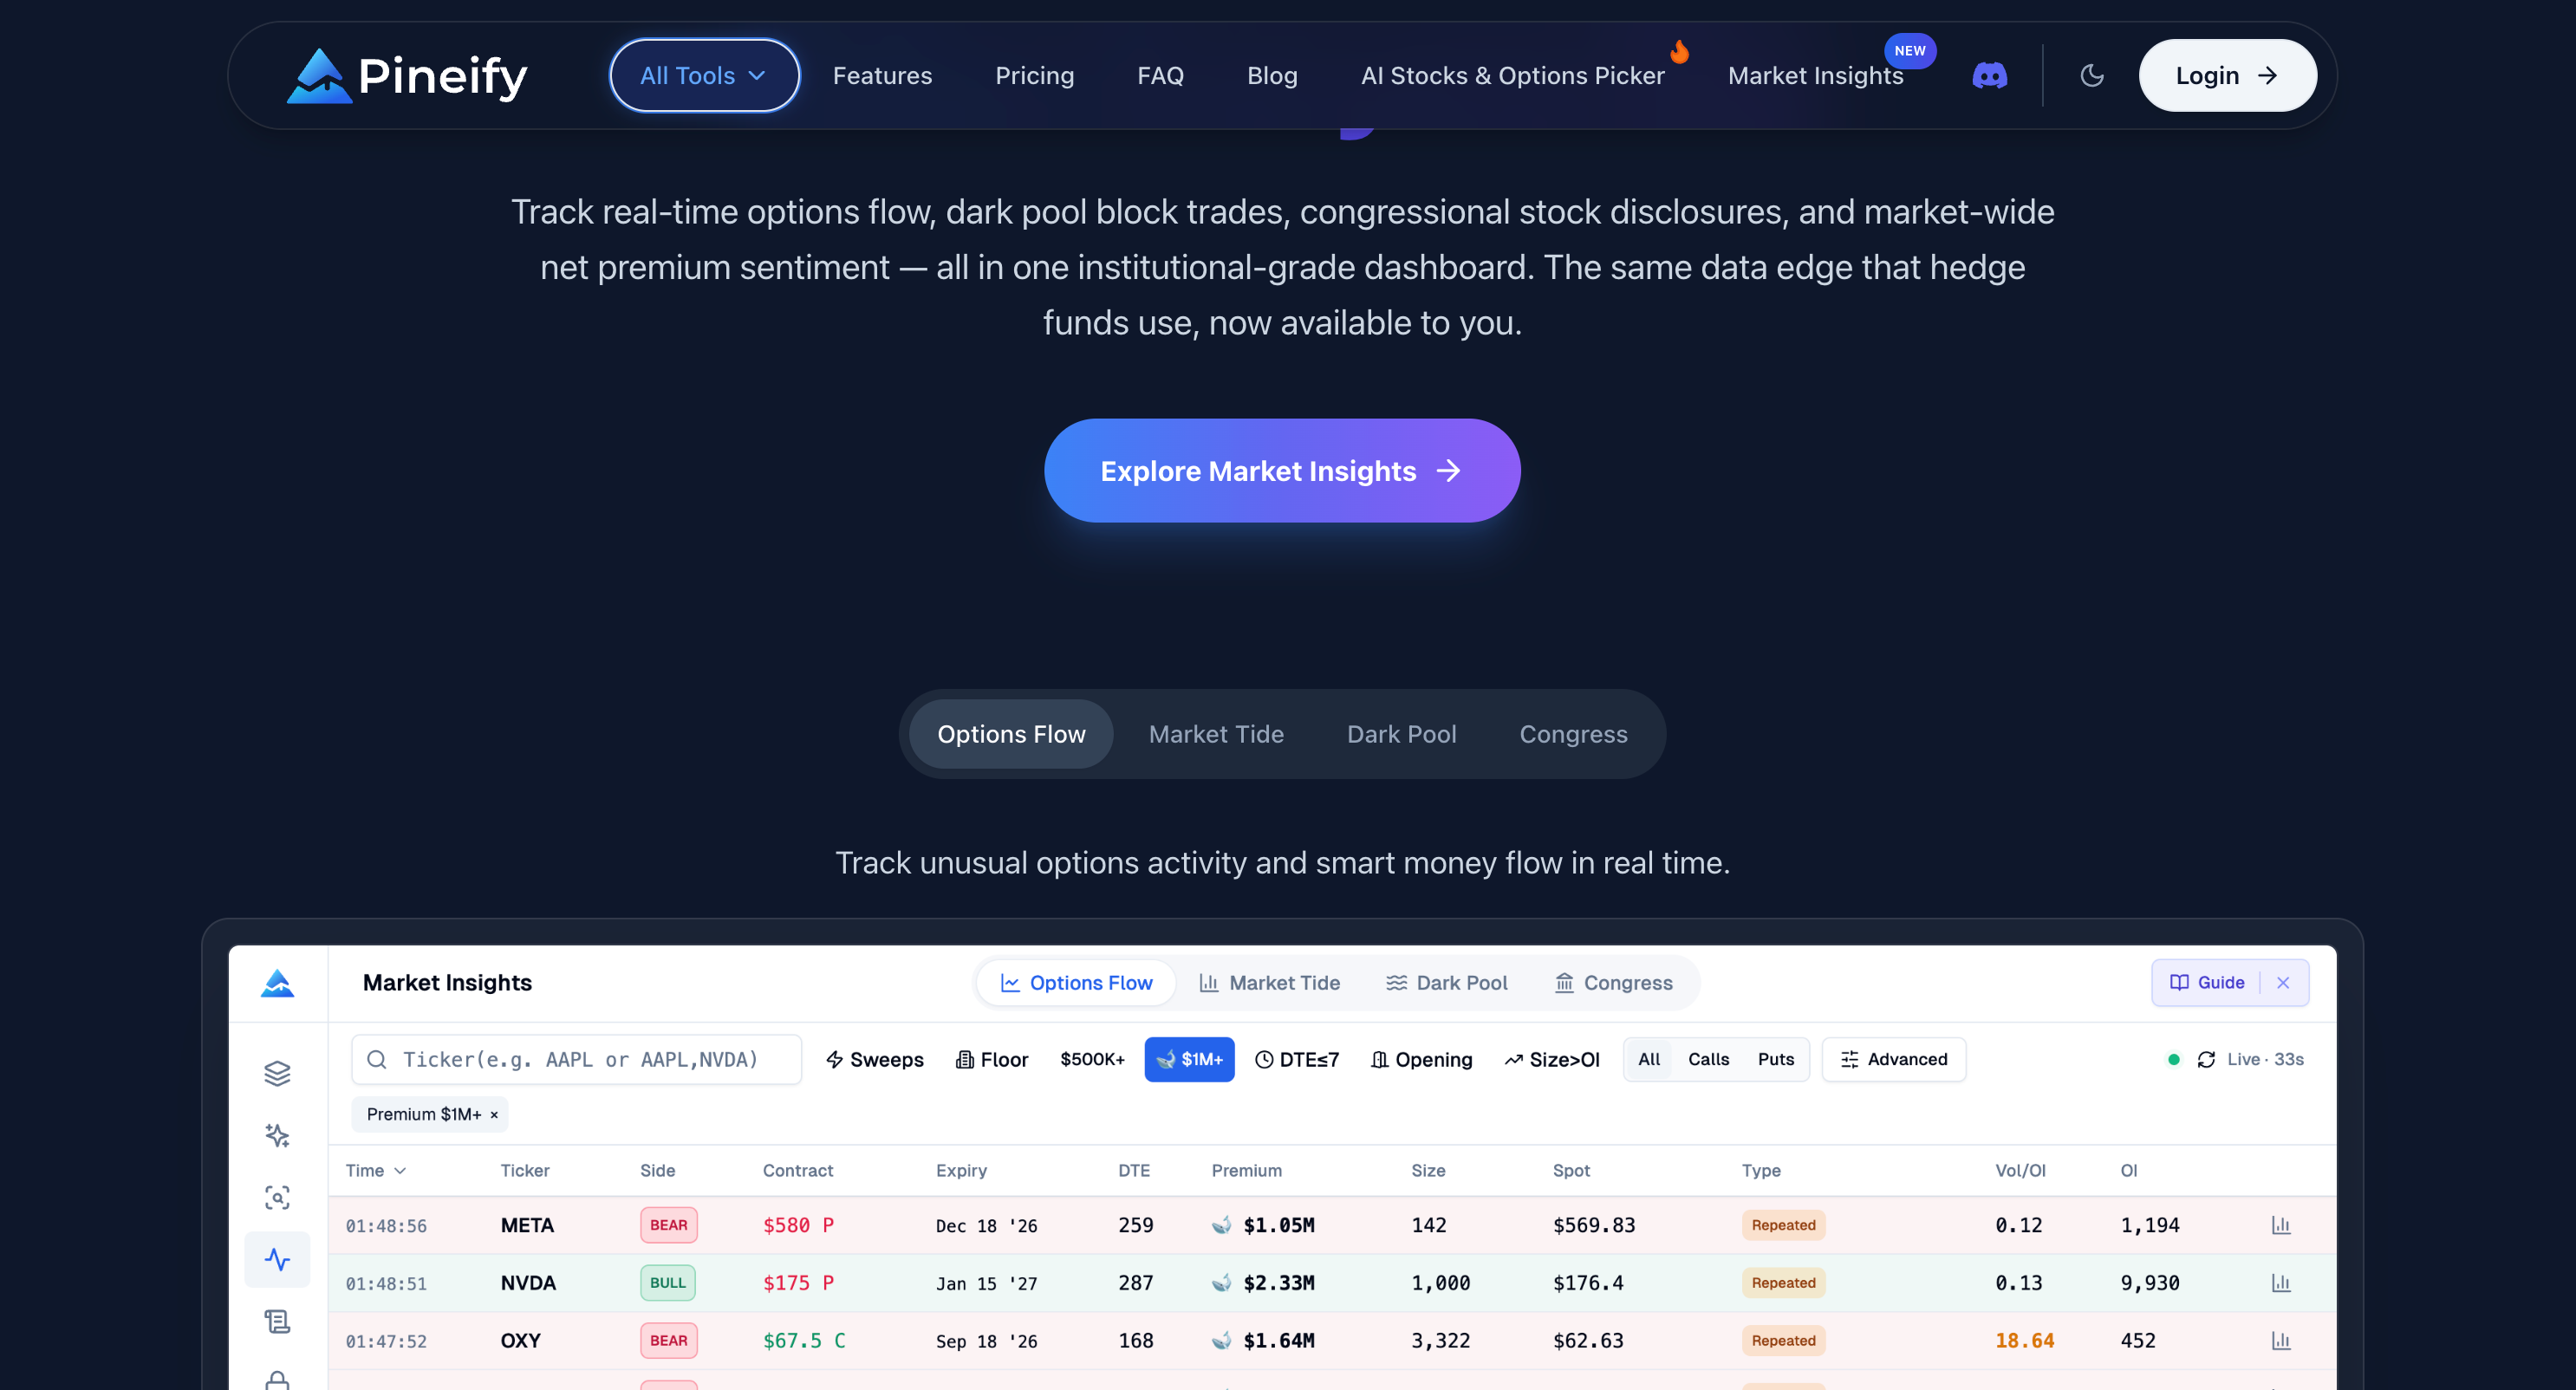
Option flow data is the record of every large options trade executed across U.S. exchanges in real time. It shows you where institutional money is moving before the stock price fully catches up. I've been watching this data for about two years now, and it changed my approach to entry timing. When you see a 500-contract sweep of TSLA calls hit multiple exchanges in under a second, that's not a retail trader guessing — it's a fund making a high-conviction bet.
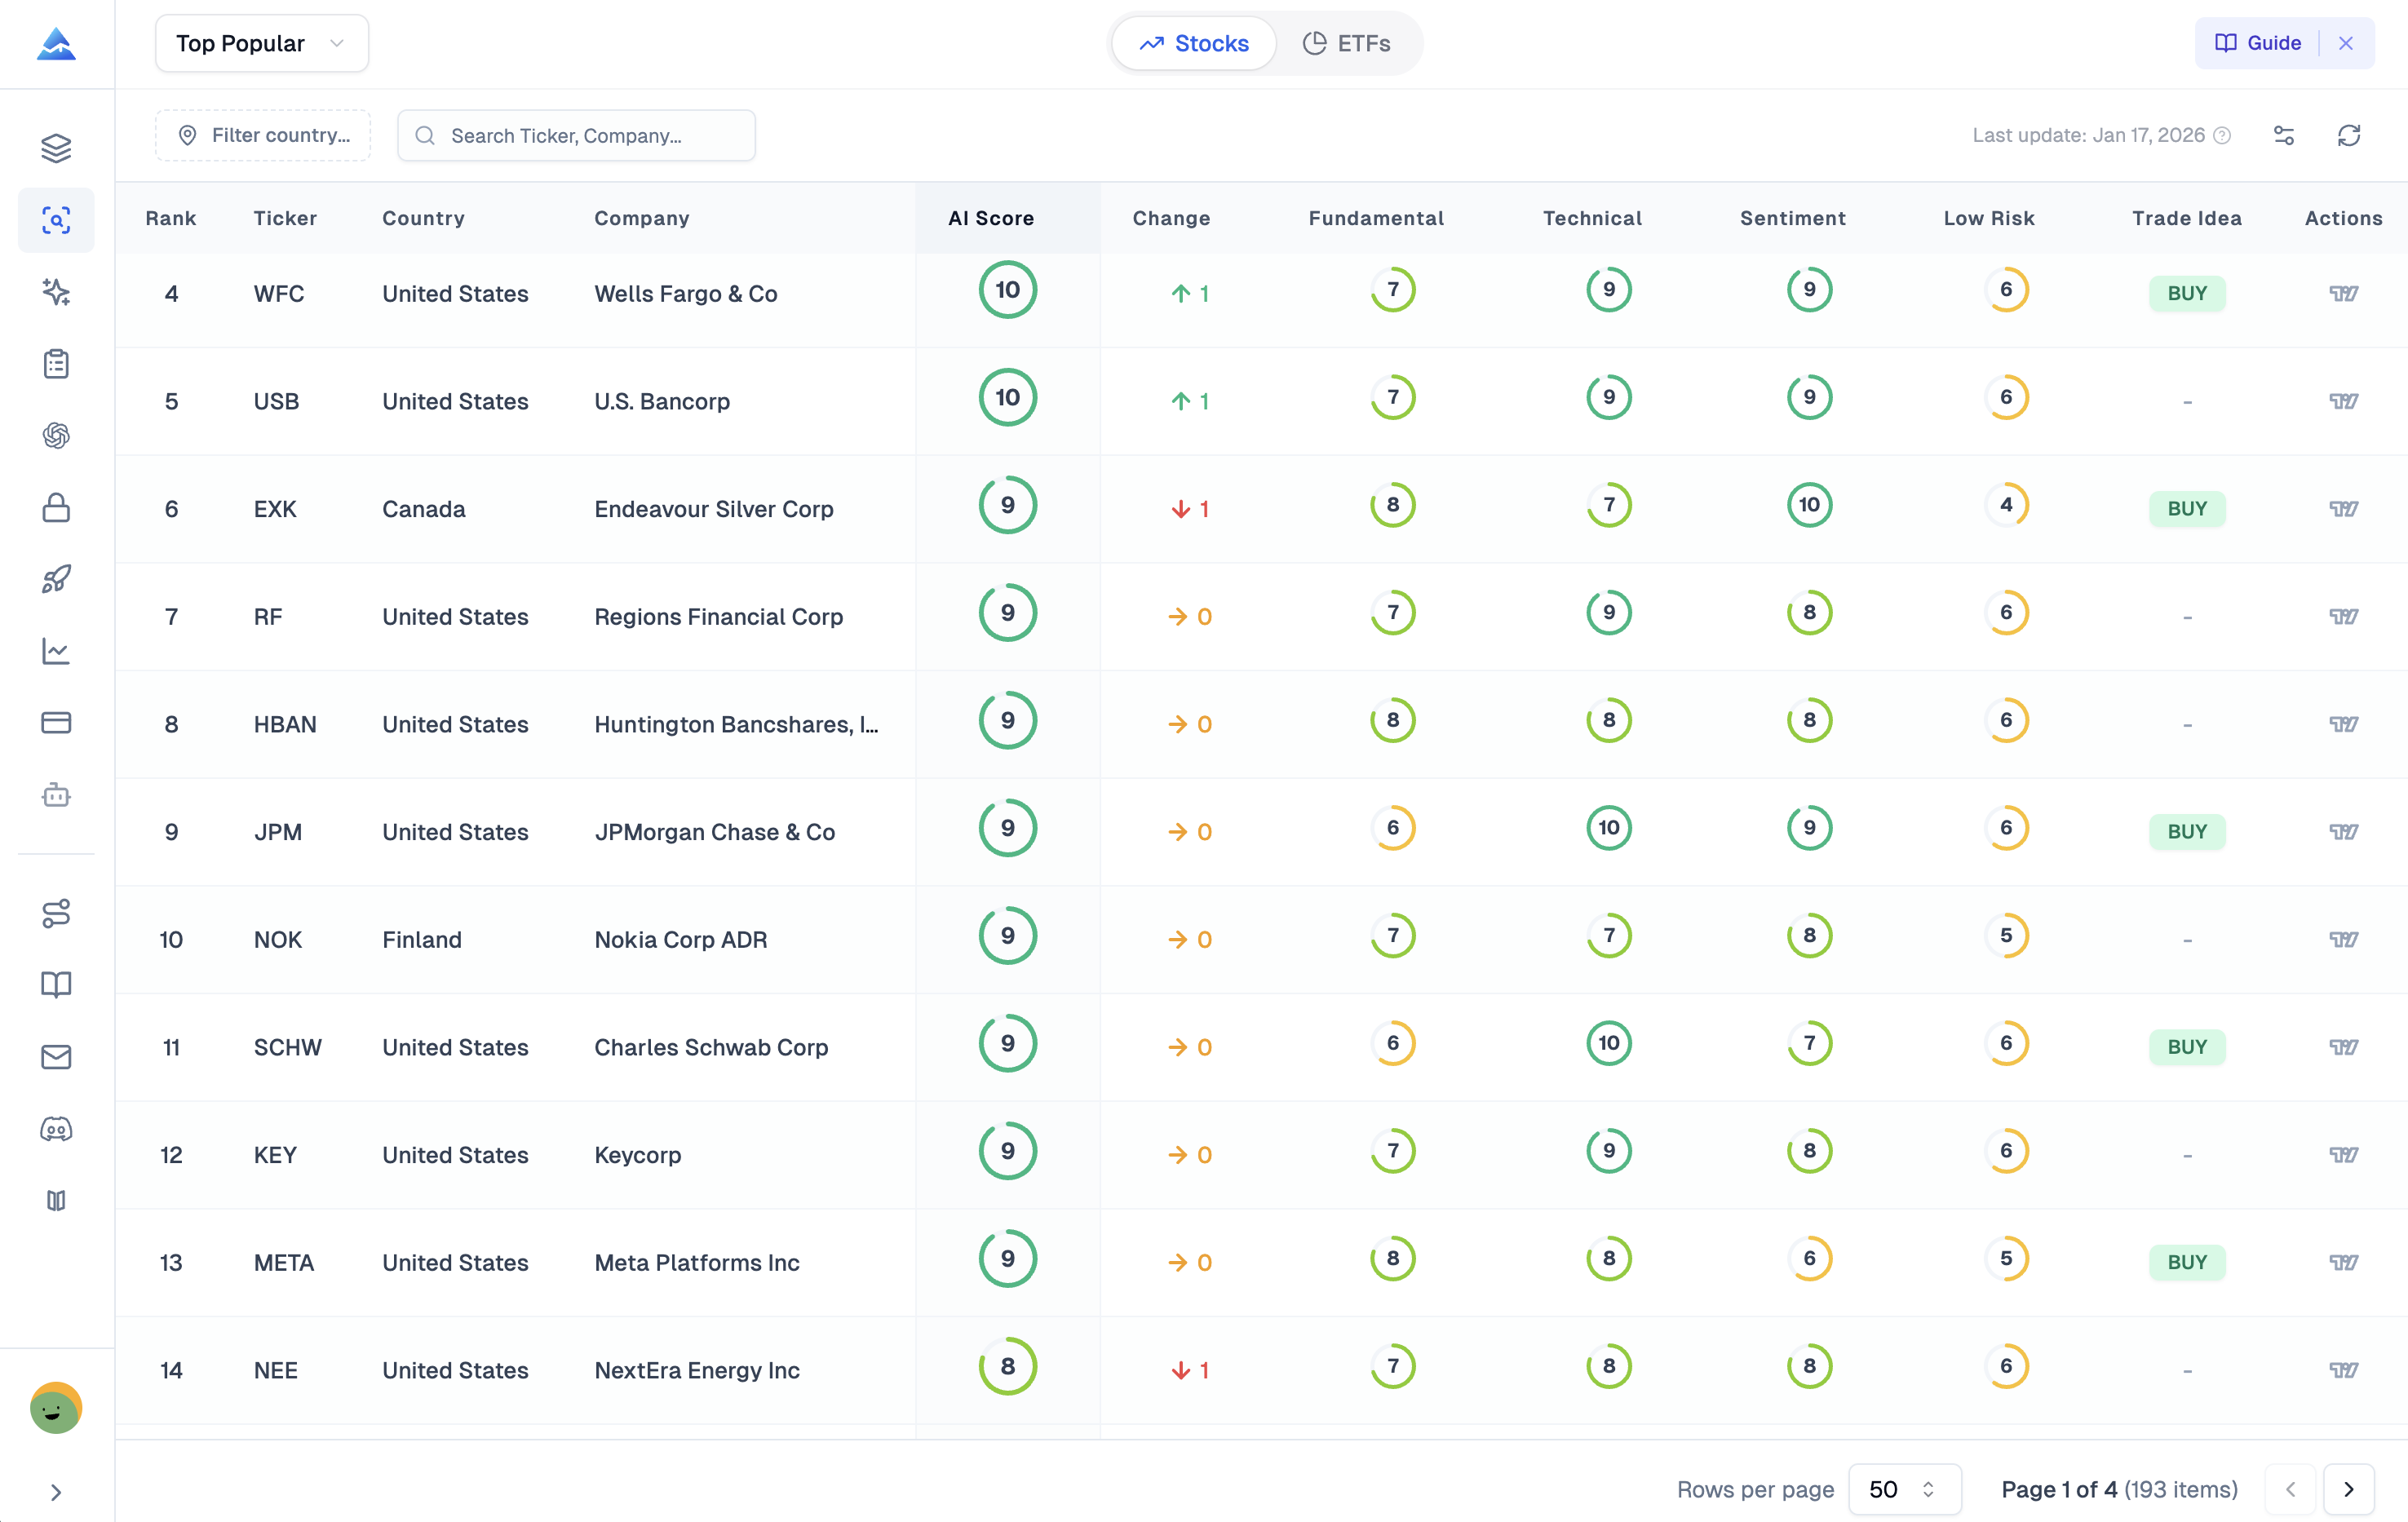
Pineify AI Stocks & Options Picker is an AI-powered analytics platform that scores stocks daily from 1 to 10 and connects directly to live options chains inside TradingView. I've tested both Pineify and Market Chameleon over the last few months, and for most individual traders, Pineify comes out ahead. Market Chameleon has deeper historical earnings data, no question. But Pineify's integrated approach saves me hours of manual screening every week.
An MT5 arrow signal indicator is a custom technical tool for MetaTrader 5 that places buy and sell arrows directly on your price chart. Instead of asking you to interpret crossovers or divergences, it runs multiple rules behind the scenes and puts one clear signal in front of you: a green arrow for buy, a red arrow for sell.
Every trader has been there — staring at a chart cluttered with lines, oscillators, and candles, wondering when to actually enter a trade. I've been there plenty of times myself. On EUR/USD last December, I tested three different arrow indicators side by side, and the difference between a repainting and a non-repainting version was night and day. The repainting one showed a 78% win rate in backtest but barely broke even in forward testing.
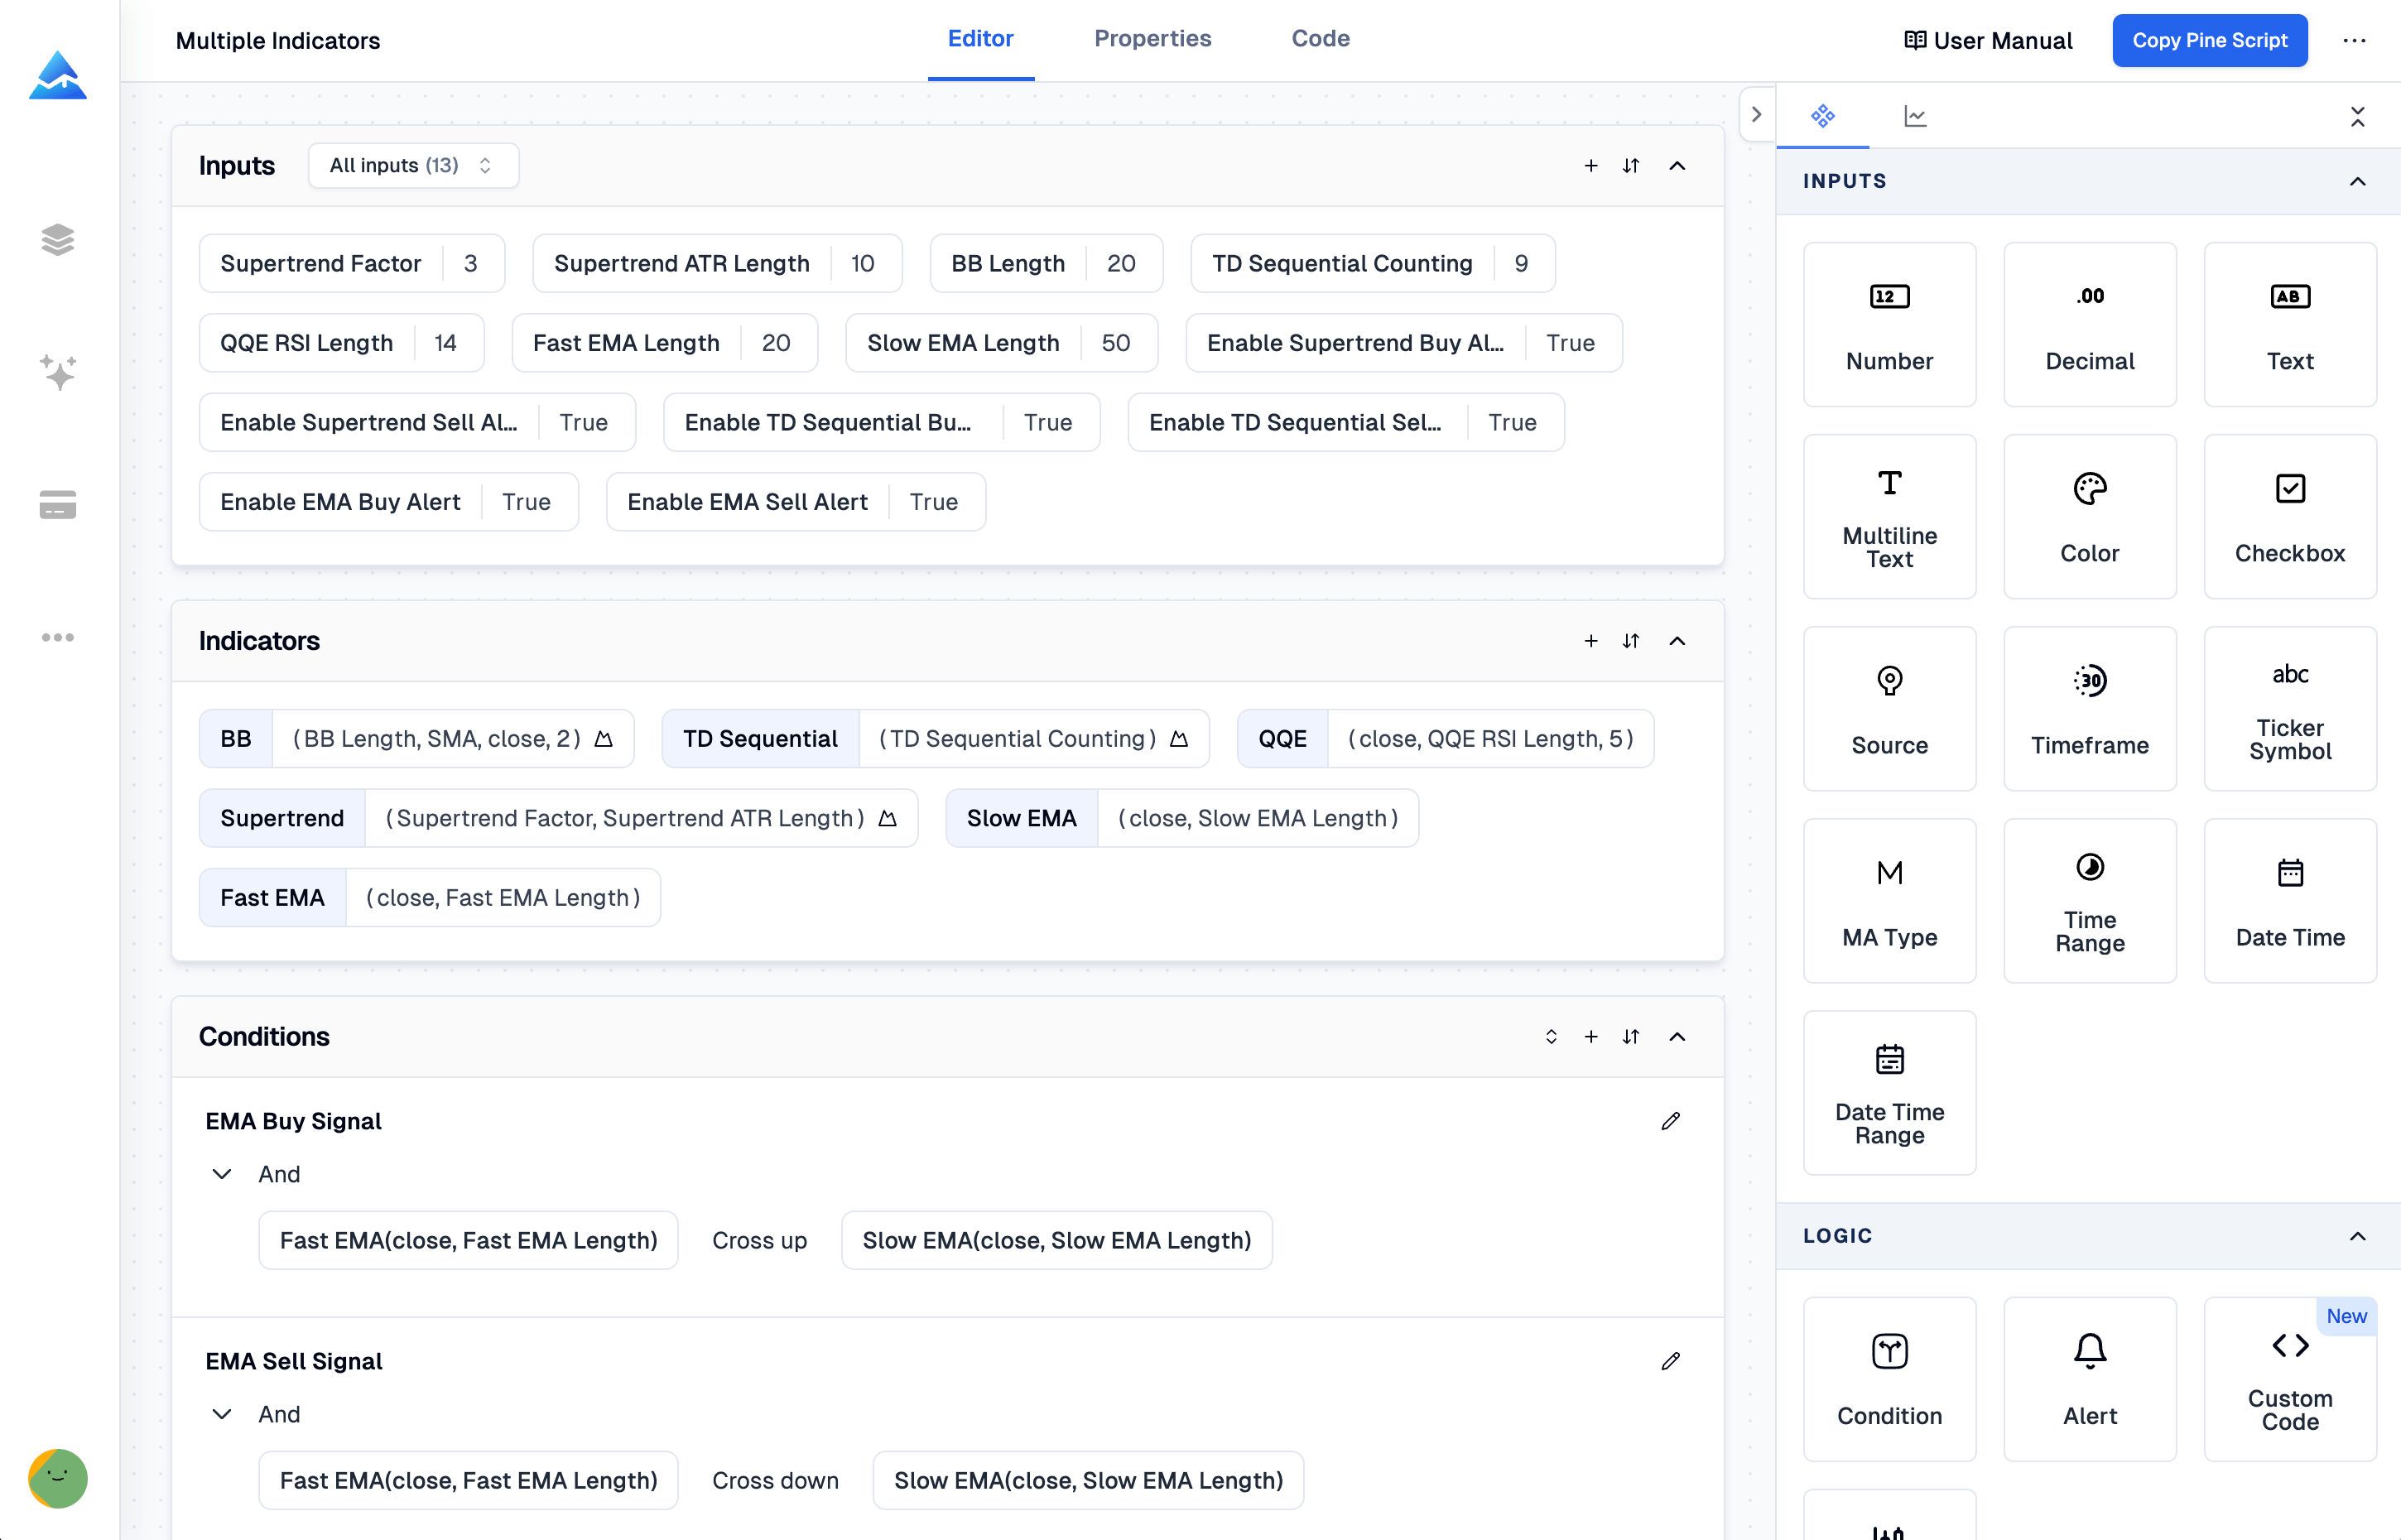
NinjaScript is NinjaTrader's native scripting language, built on C# and designed for serious futures and forex automation. It gives you total control — if you can write the code. Most traders can't, and I don't blame them. I've scrapped more NinjaScript projects than I've finished, each one dying somewhere in the compile-debug cycle. For TradingView users who want custom indicators without that learning curve, Pineify's visual editor is the practical choice. It won't replace NinjaTrader's order execution — I should be upfront about that — but for building indicators visually and deploying on TradingView in minutes, I haven't found anything faster.