546 posts tagged with "Pine Script"

Blog posts related to the PineScript

View All Tags

Magnifi vs Pineify AI Finance Agent: Which AI Investing Tool Wins?

· 14 min read
Pineify Team
Pine Script and AI trading workflow research team

The first thing you need to know: Pineify's Finance AI Agent beats Magnifi for active traders, plain and simple. An AI finance agent is a tool that takes your plain-English questions and pulls live market data to give you tradeable answers. I've tested both platforms for over four months on real portfolios, running the same queries on NVDA, TSLA, and QQQ options chains. Magnifi works fine if you're a casual investor who just wants a dashboard. But I wouldn't use it for options analysis or insider trade tracking — Pineify handles both far better.

Magnifi vs Pineify AI Finance Agent: Which AI Investing Tool Delivers Better Results?

Mansfield Relative Strength: Spot Stocks Outperforming the Market

· 14 min read
Pineify Team
Pine Script and AI trading workflow research team

Mansfield Relative Strength is a comparative momentum indicator that measures a stock's return against the S&P 500, showing you whether it's genuinely outperforming or just riding the market's coattails. I've been burned too many times by stocks that looked strong on their own chart but were actually lagging the broader market — this indicator fixed that blind spot for me.

Most traders obsess over whether a stock is going up or down. The better question is whether it's going up faster than everything else. MRS answers that with a single line normalized around zero. Above zero means outperformance. Below zero means the stock is underperforming. No guesswork.

When AAPL was up 2% in a day last November but the S&P 500 gained 3.1%, MRS showed a negative reading. I'd have missed that warning if I only stared at AAPL's green candle. That's the whole value of this tool — it forces you to compare, not just observe.
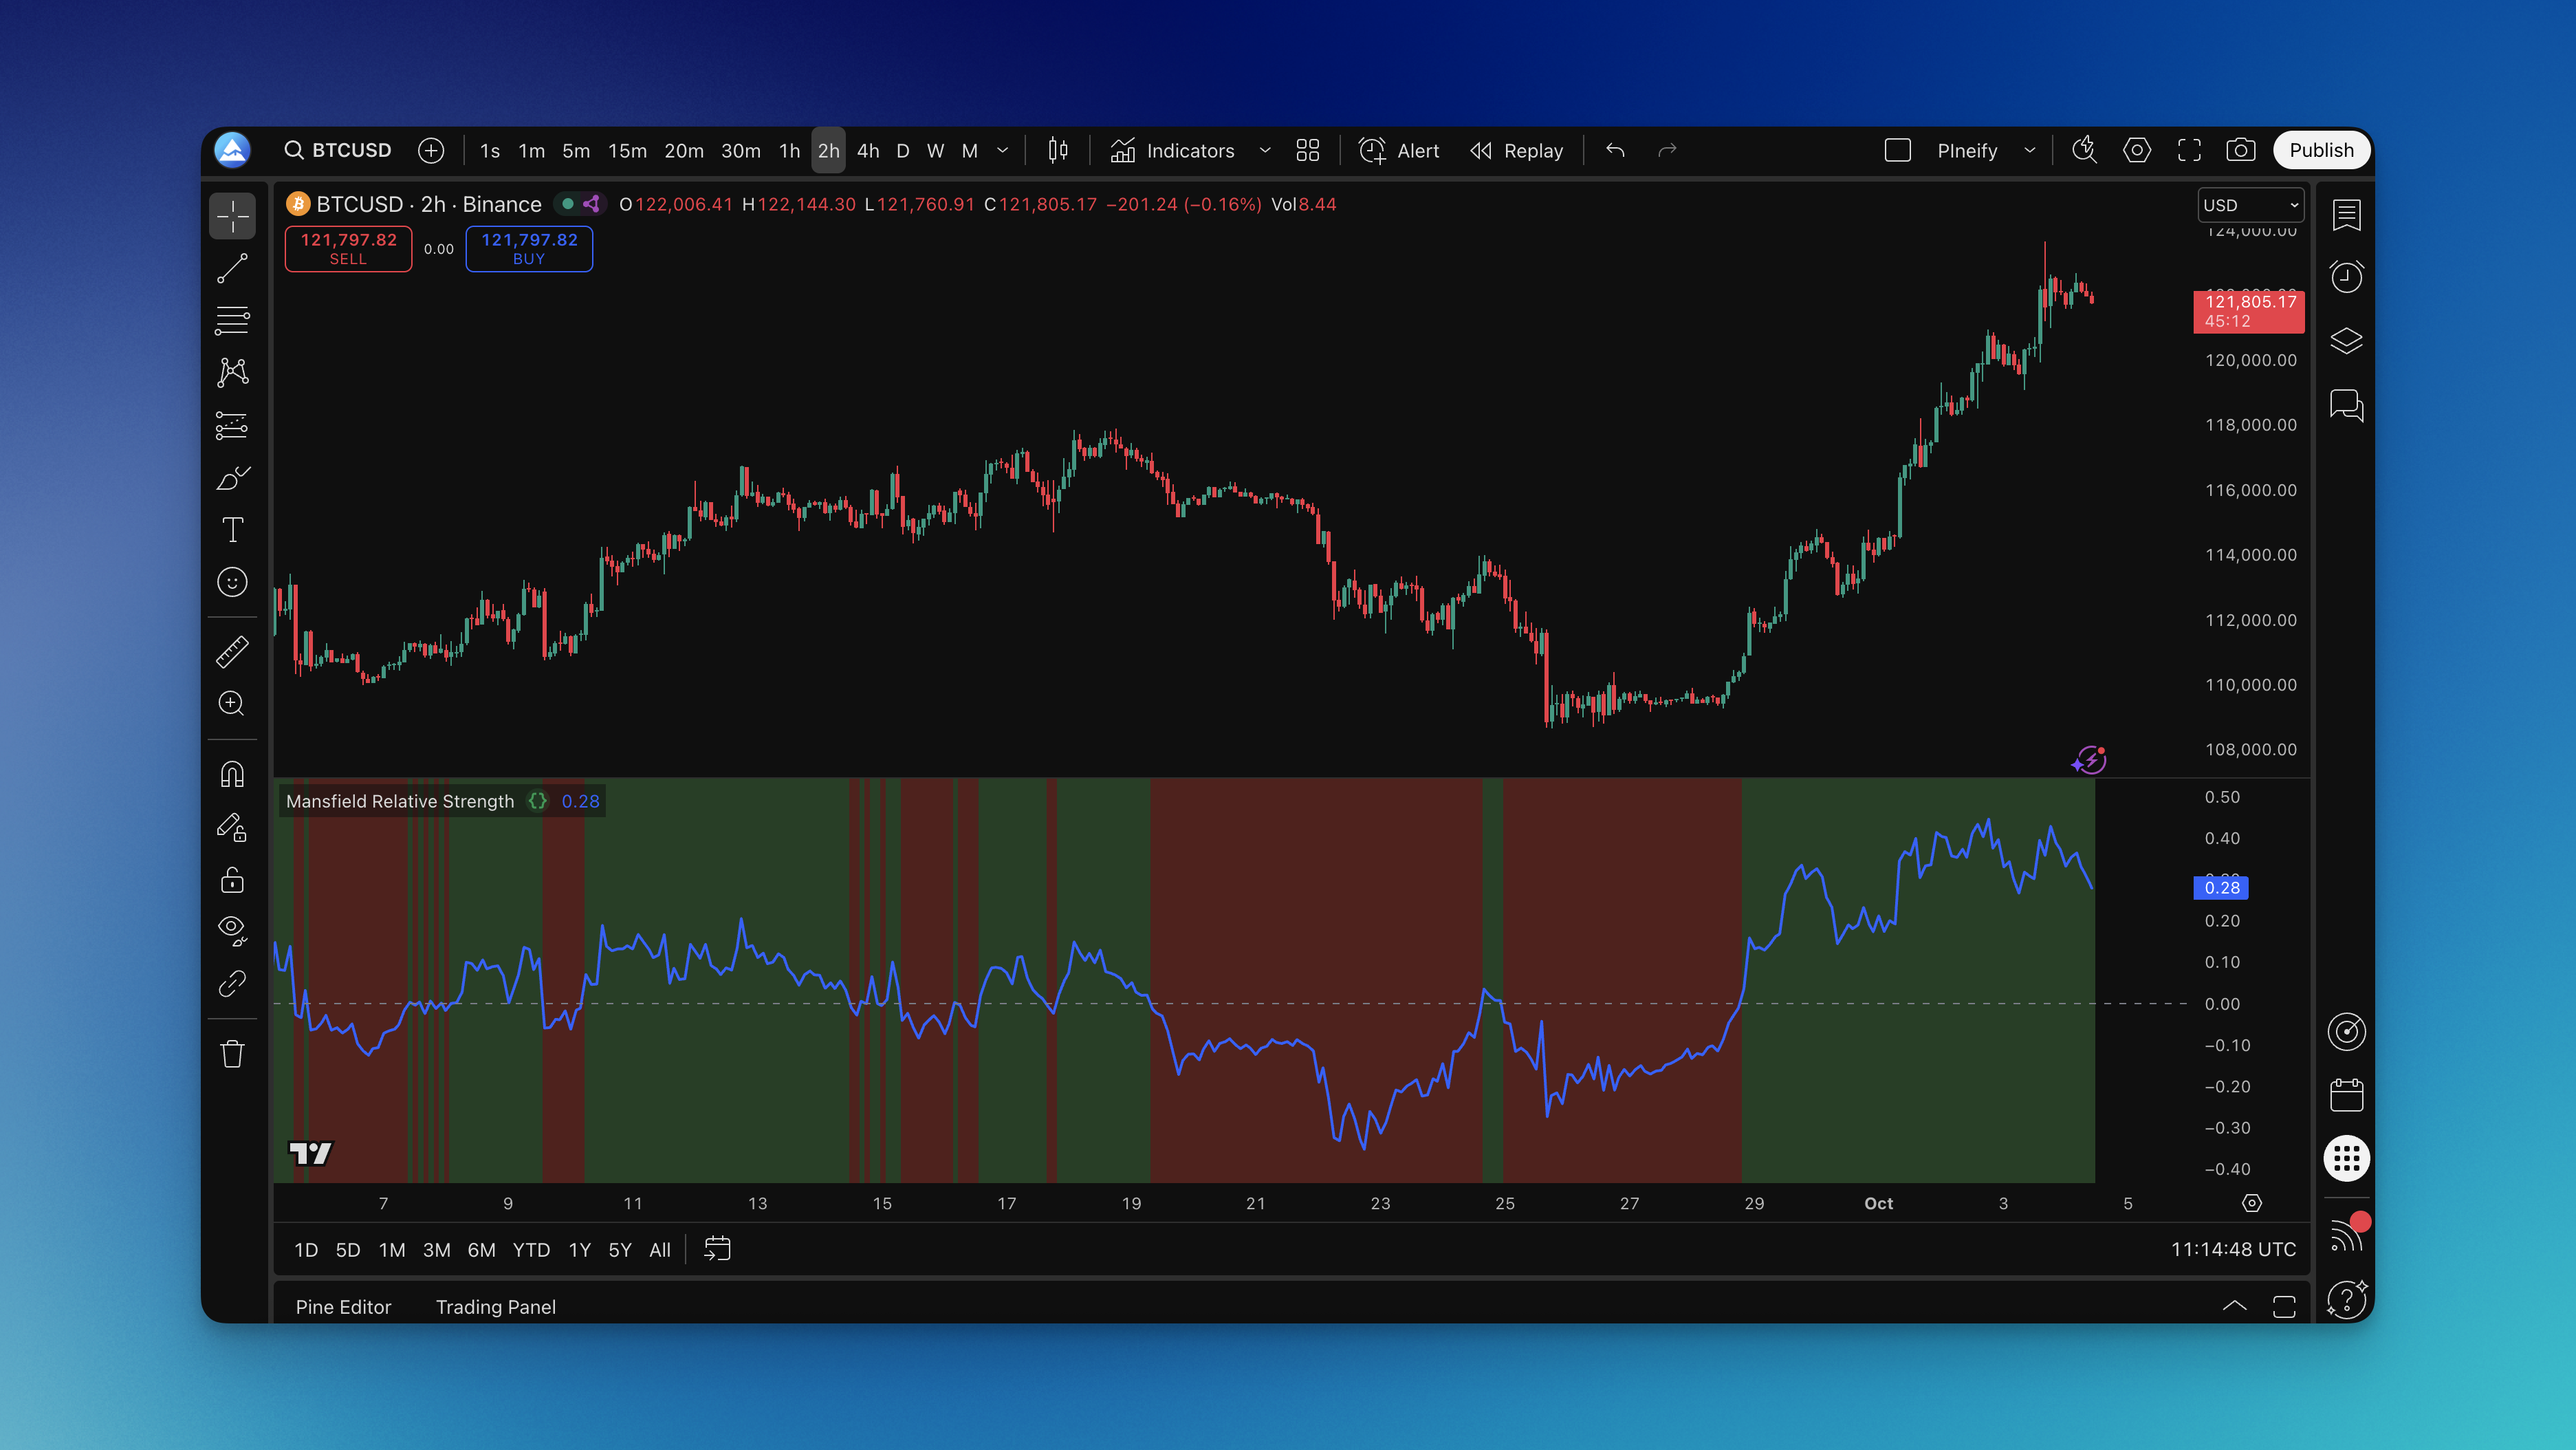
Mansfield Relative Strength Indicator on Chart

ChartDetector Alternative: Pineify AI Stock Chart Analysis

· 12 min read
Pineify Team
Pine Script and AI trading workflow research team

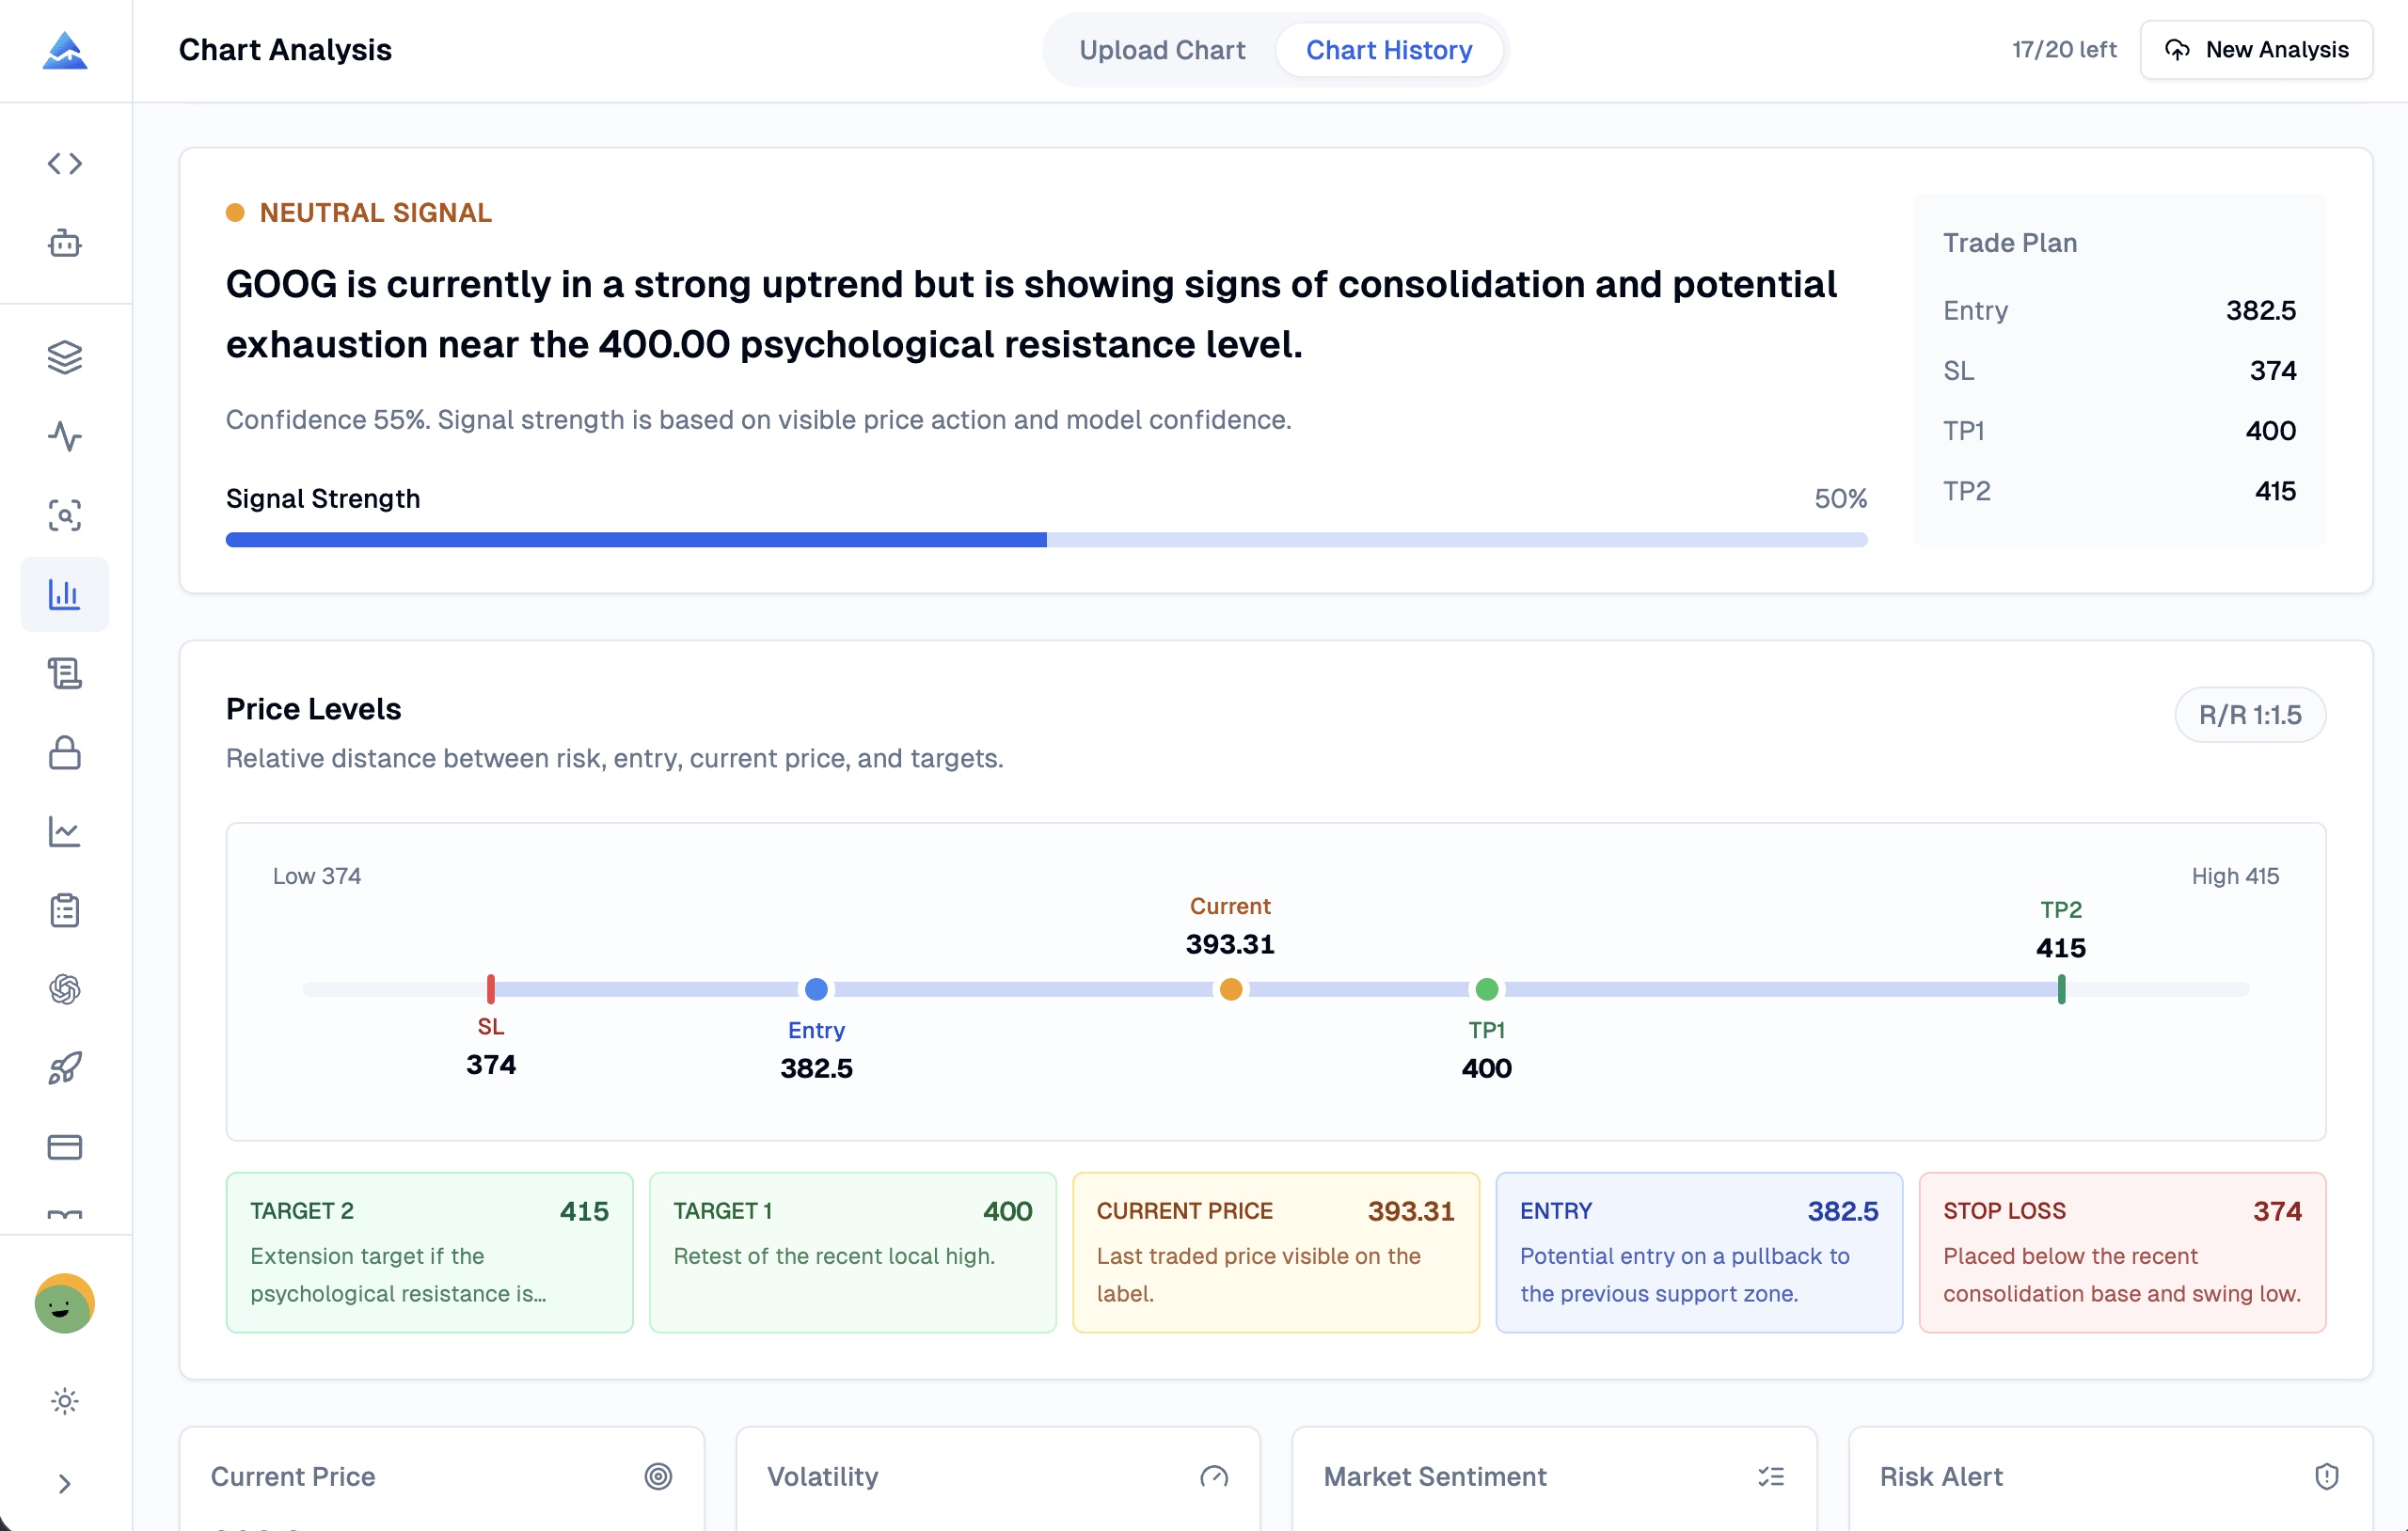
A search for a ChartDetector alternative usually starts with one task: upload a stock chart and get a useful technical read without drawing every level by hand. Pineify handles that task with a focused screenshot workflow. It reads visible price action and returns a signal, confidence score, support, resistance, entry, stop loss, two targets, risk notes, and a saved analysis record.

ChartDetector and Pineify overlap, but they are not identical products. ChartDetector is a broad trading decision-intelligence platform with market scans, multi-timeframe analysis, portfolio tools, correlation analysis, and backtesting. Pineify AI Stock Chart Analysis is a better fit when you want a repeatable review of one chart screenshot and an output format that is easy to audit.

Pineify AI Stock Chart Analysis dashboard with signal confidence, support, resistance, entry, stop loss, and target levels

Marc Chaikin AI Stock Picks: Power Gauge Analysis

· 11 min read
Pineify Team
Pine Script and AI trading workflow research team

The Marc Chaikin AI stock pick system, known as the Power Gauge, is a data-driven tool that scores stocks by analyzing over 20 fundamental and technical factors. It launched in 2011 and uses machine learning to predict which stocks will outperform or underperform the market over one to six months. I've been following Chaikin's work since 2011, and the Power Gauge has consistently been one of the most interesting AI-driven rating systems I've come across.

Marc Chaikin AI Stock Picks: The Complete Guide to Power Gauge Analysis

Market Facilitation Index: Color Bars That Reveal Real Market Flow

· 8 min read
Pineify Team
Pine Script and AI trading workflow research team

The Market Facilitation Index (MFI) is a Bill Williams indicator that measures market efficiency. Take the price range, divide by volume. Higher numbers mean price moves more per unit of volume. Lower numbers mean the market is stalling. Williams gave each bar a color: green when both price range and volume rise, blue when both fall, gray when price moves on weak volume, and red when heavy volume meets little price movement. I've traded MFI on US equities since early 2024 and it behaves differently than I expected on short timeframes. Red bars show up more often on 5-minute charts than I'd like.

Backtrader Multiple Timeframes: Multi-Timeframe Trading in Python

· 11 min read
Pineify Team
Pine Script and AI trading workflow research team

Multi-timeframe trading in Backtrader combines chart data from different periods -- weekly, daily, hourly -- so your strategy sees both the broad trend and the fine-grained entry signal. I've run this setup on SPY since January 2024, pairing the daily chart for entries with the weekly chart for direction. It cut my false signals by about 30% compared to trading the daily chart alone.

Backtrader Multiple Timeframes Multi-Timeframe Trading Strategy Setup

Funding Rate Strategies to Profit From Crypto Perpetual Futures

· 11 min read
Pineify Team
Pine Script and AI trading workflow research team

The crypto perpetual futures market moves billions in funding fees every week. Longs pay shorts when Bitcoin pushes higher. Shorts pay longs when sentiment flips. I've been testing a delta-neutral strategy on ETH since March 2025 and the monthly return averaged 2.1% over three months — not life-changing, but it beat every DeFi yield on my radar.

Funding rate strategy is a trading approach that captures the periodic fees exchanged between long and short traders in perpetual futures markets. Instead of betting on price direction, you set up matched positions that collect those built-in payments while staying neutral to market moves. I prefer this over directional trading in choppy markets — it removes the constant second-guessing about where BTC will go next.

Master Funding Rate Strategies for Consistent Crypto Trading Profits

Multi Time Frame Candle TradingView: Read Higher Timeframes Instantly

· 15 min read
Pineify Team
Pine Script and AI trading workflow research team

Multi-timeframe candle analysis is a TradingView technique that overlays higher timeframe candles directly onto your current chart. I've been running this setup for about three years on ES futures and BTC/USD, and it filters out lower-timeframe noise better than anything else I've tried. You can watch a 5-minute chart while still seeing where the 1-hour candle is forming — no tab switching required.

Multi Time Frame Candle TradingView: Complete Analysis Guide

ATR Strategy Guide: Using Average True Range for Better Trading

· 16 min read
Pineify Team
Pine Script and AI trading workflow research team

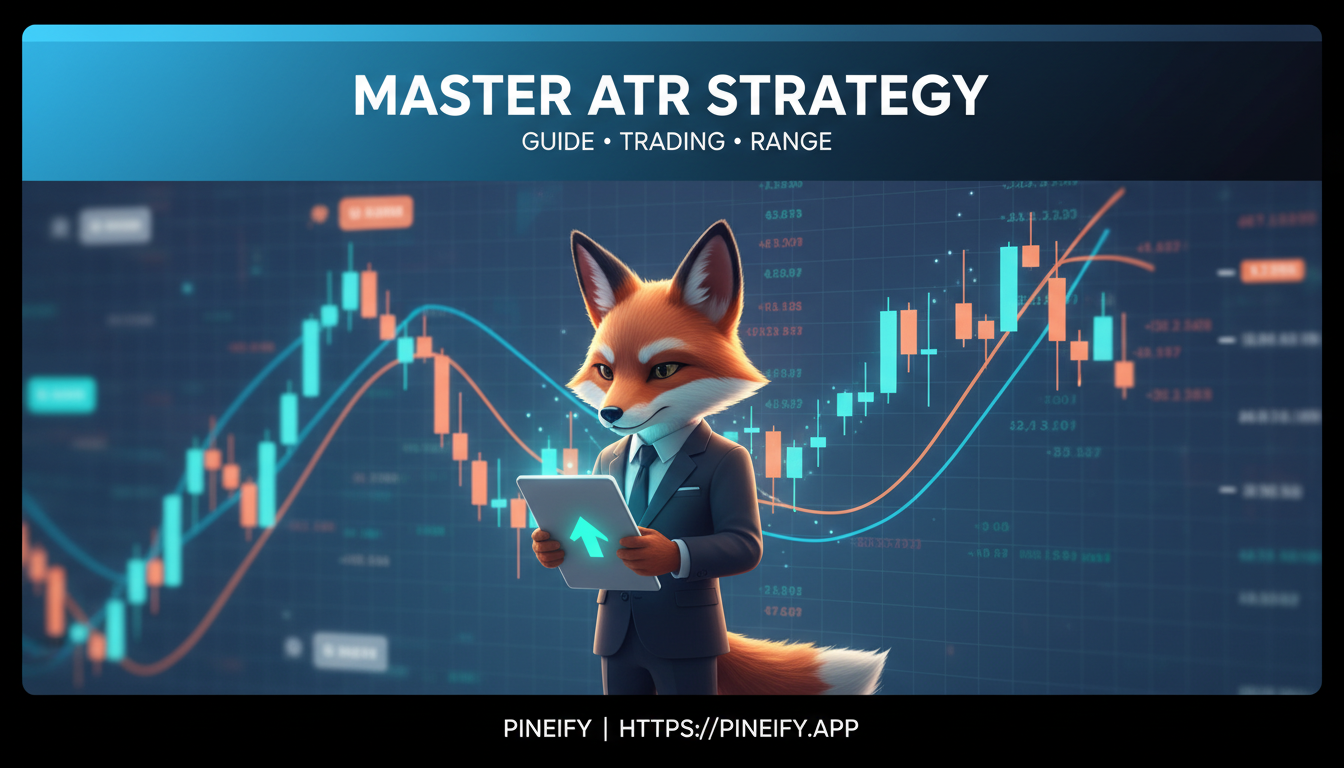
You can study every chart pattern and indicator out there, but if you don't account for volatility, your stop-loss will get taken out before the trade even develops. Average True Range (ATR) is a volatility indicator created by J. Welles Wilder. It measures how much an asset's price moves over a set period — no direction, just the raw range. I use it to place stops and size positions based on what the market actually does. It's saved me from getting stopped out of good trades more times than I can count.

Master the ATR Strategy: Complete Guide to Trading with Average True Range

Donchian Channel Breakout Strategy: Rules That Actually Work

· 17 min read
Pineify Team
Pine Script and AI trading workflow research team

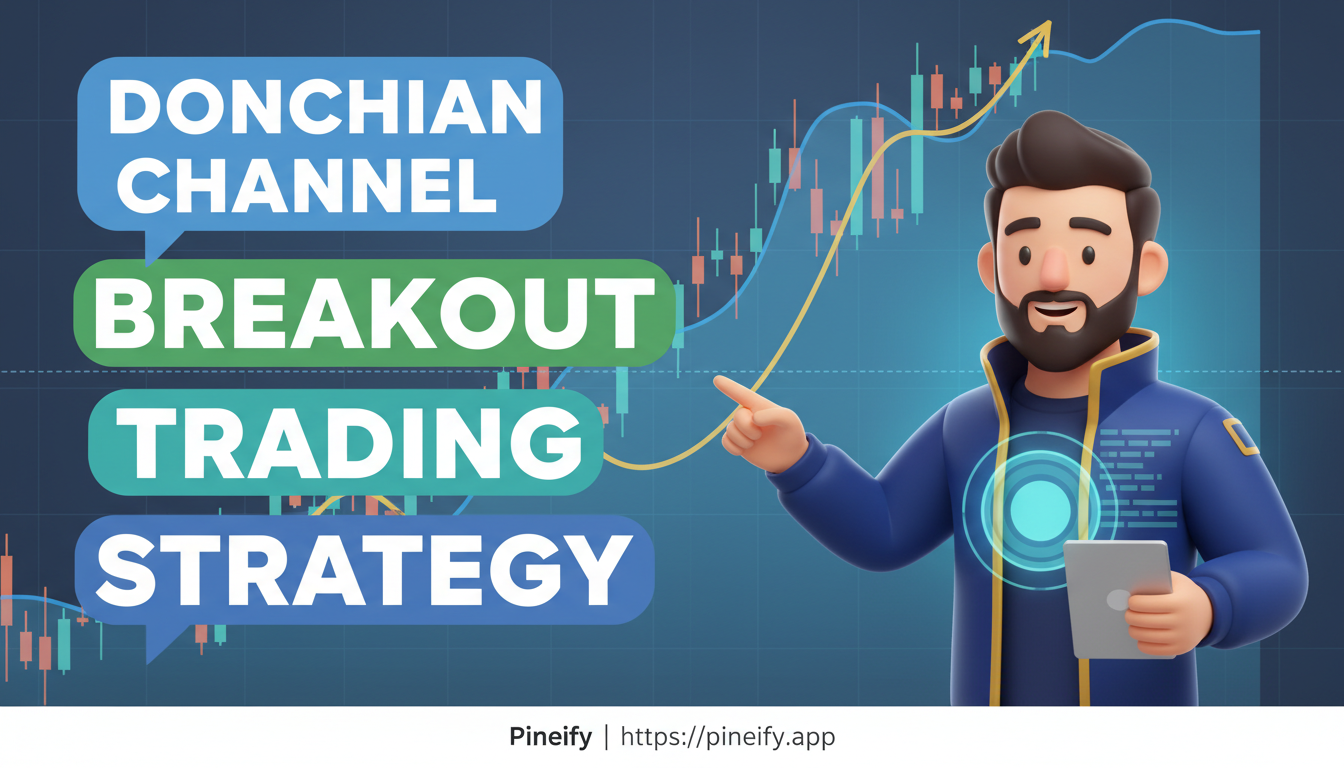
Struggling to spot trends early or catch those big market moves? Donchian Channels are a trend-following indicator built from three lines: the highest high over N periods, the lowest low over N periods, and the midpoint between them. They're designed to identify breakouts and ride momentum. Developed by Richard Donchian, this tool was used by the Turtle Traders to find success across stocks, futures, and forex markets.

Master the Donchian Channel Strategy: Complete Guide to Breakout Trading Success