Automated Trading in TradingView: Strategy Automation for Real Traders

· 15 min read

Pineify Team
Pine Script and AI trading workflow research team

Automated trading in TradingView is the practice of using Pine Script strategies and webhook alerts to execute trades without manual intervention. You define entry and exit rules, backtest them against historical data, then let the system watch the markets and send orders on your behalf around the clock. The real work is connecting TradingView's charting engine with third-party services that handle actual trade execution.

Think of TradingView as your strategy design studio. It's where you build, test, and fine-tune ideas. It doesn't place trades directly, but it gives you all the tools—Pine Script, the alert system, webhooks—to generate signals and send them out into the world.
Automated Trading in TradingView: Complete Guide to Strategy Automation

Automatic Stop Loss and Take Profit Indicator for TradingView

· 12 min read
Pineify Team
Pine Script and AI trading workflow research team

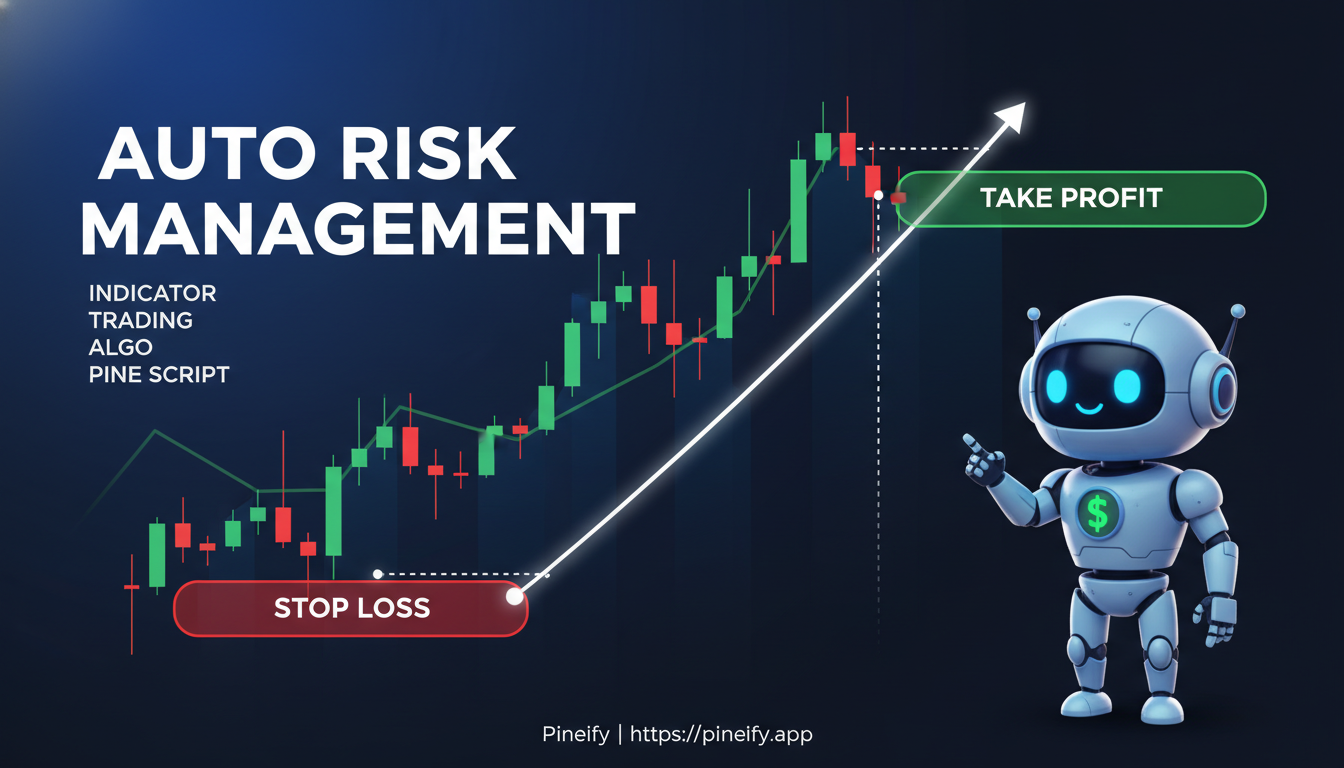
Automatic stop loss and take profit indicators are TradingView tools that calculate where your trade should exit based on formulas you choose -- ATR, percentage, or support and resistance levels. They place stop and target orders so you can step away from the charts and still stick to your risk plan. I started using an ATR-based version on SPY around March 2025, and it cut my screen time by at least half.

Automatic Stop Loss and Take Profit Indicator TradingView: Complete Guide to Automated Risk Management

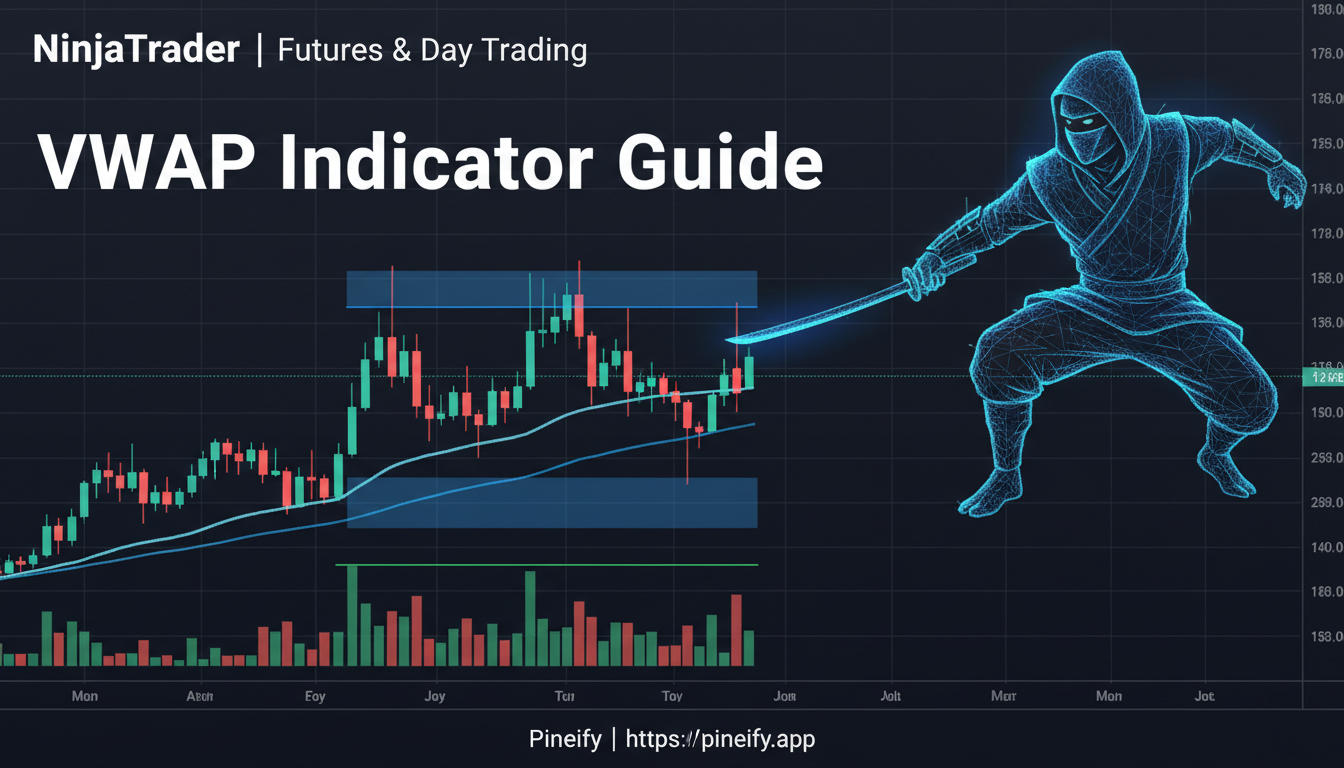
NinjaTrader VWAP Indicator for Futures and Day Trading

· 13 min read
Pineify Team
Pine Script and AI trading workflow research team

I remember the first time I put VWAP on an ES futures chart in NinjaTrader 8. It was March 2024, and price had gapped above the VWAP line at the open. Within 20 minutes, it snapped back hard. That's when it clicked: VWAP isn't just a line on a chart — it's a reference level that institutional traders actually use.


NinjaTrader VWAP Indicator: Complete Guide for Futures & Day Traders

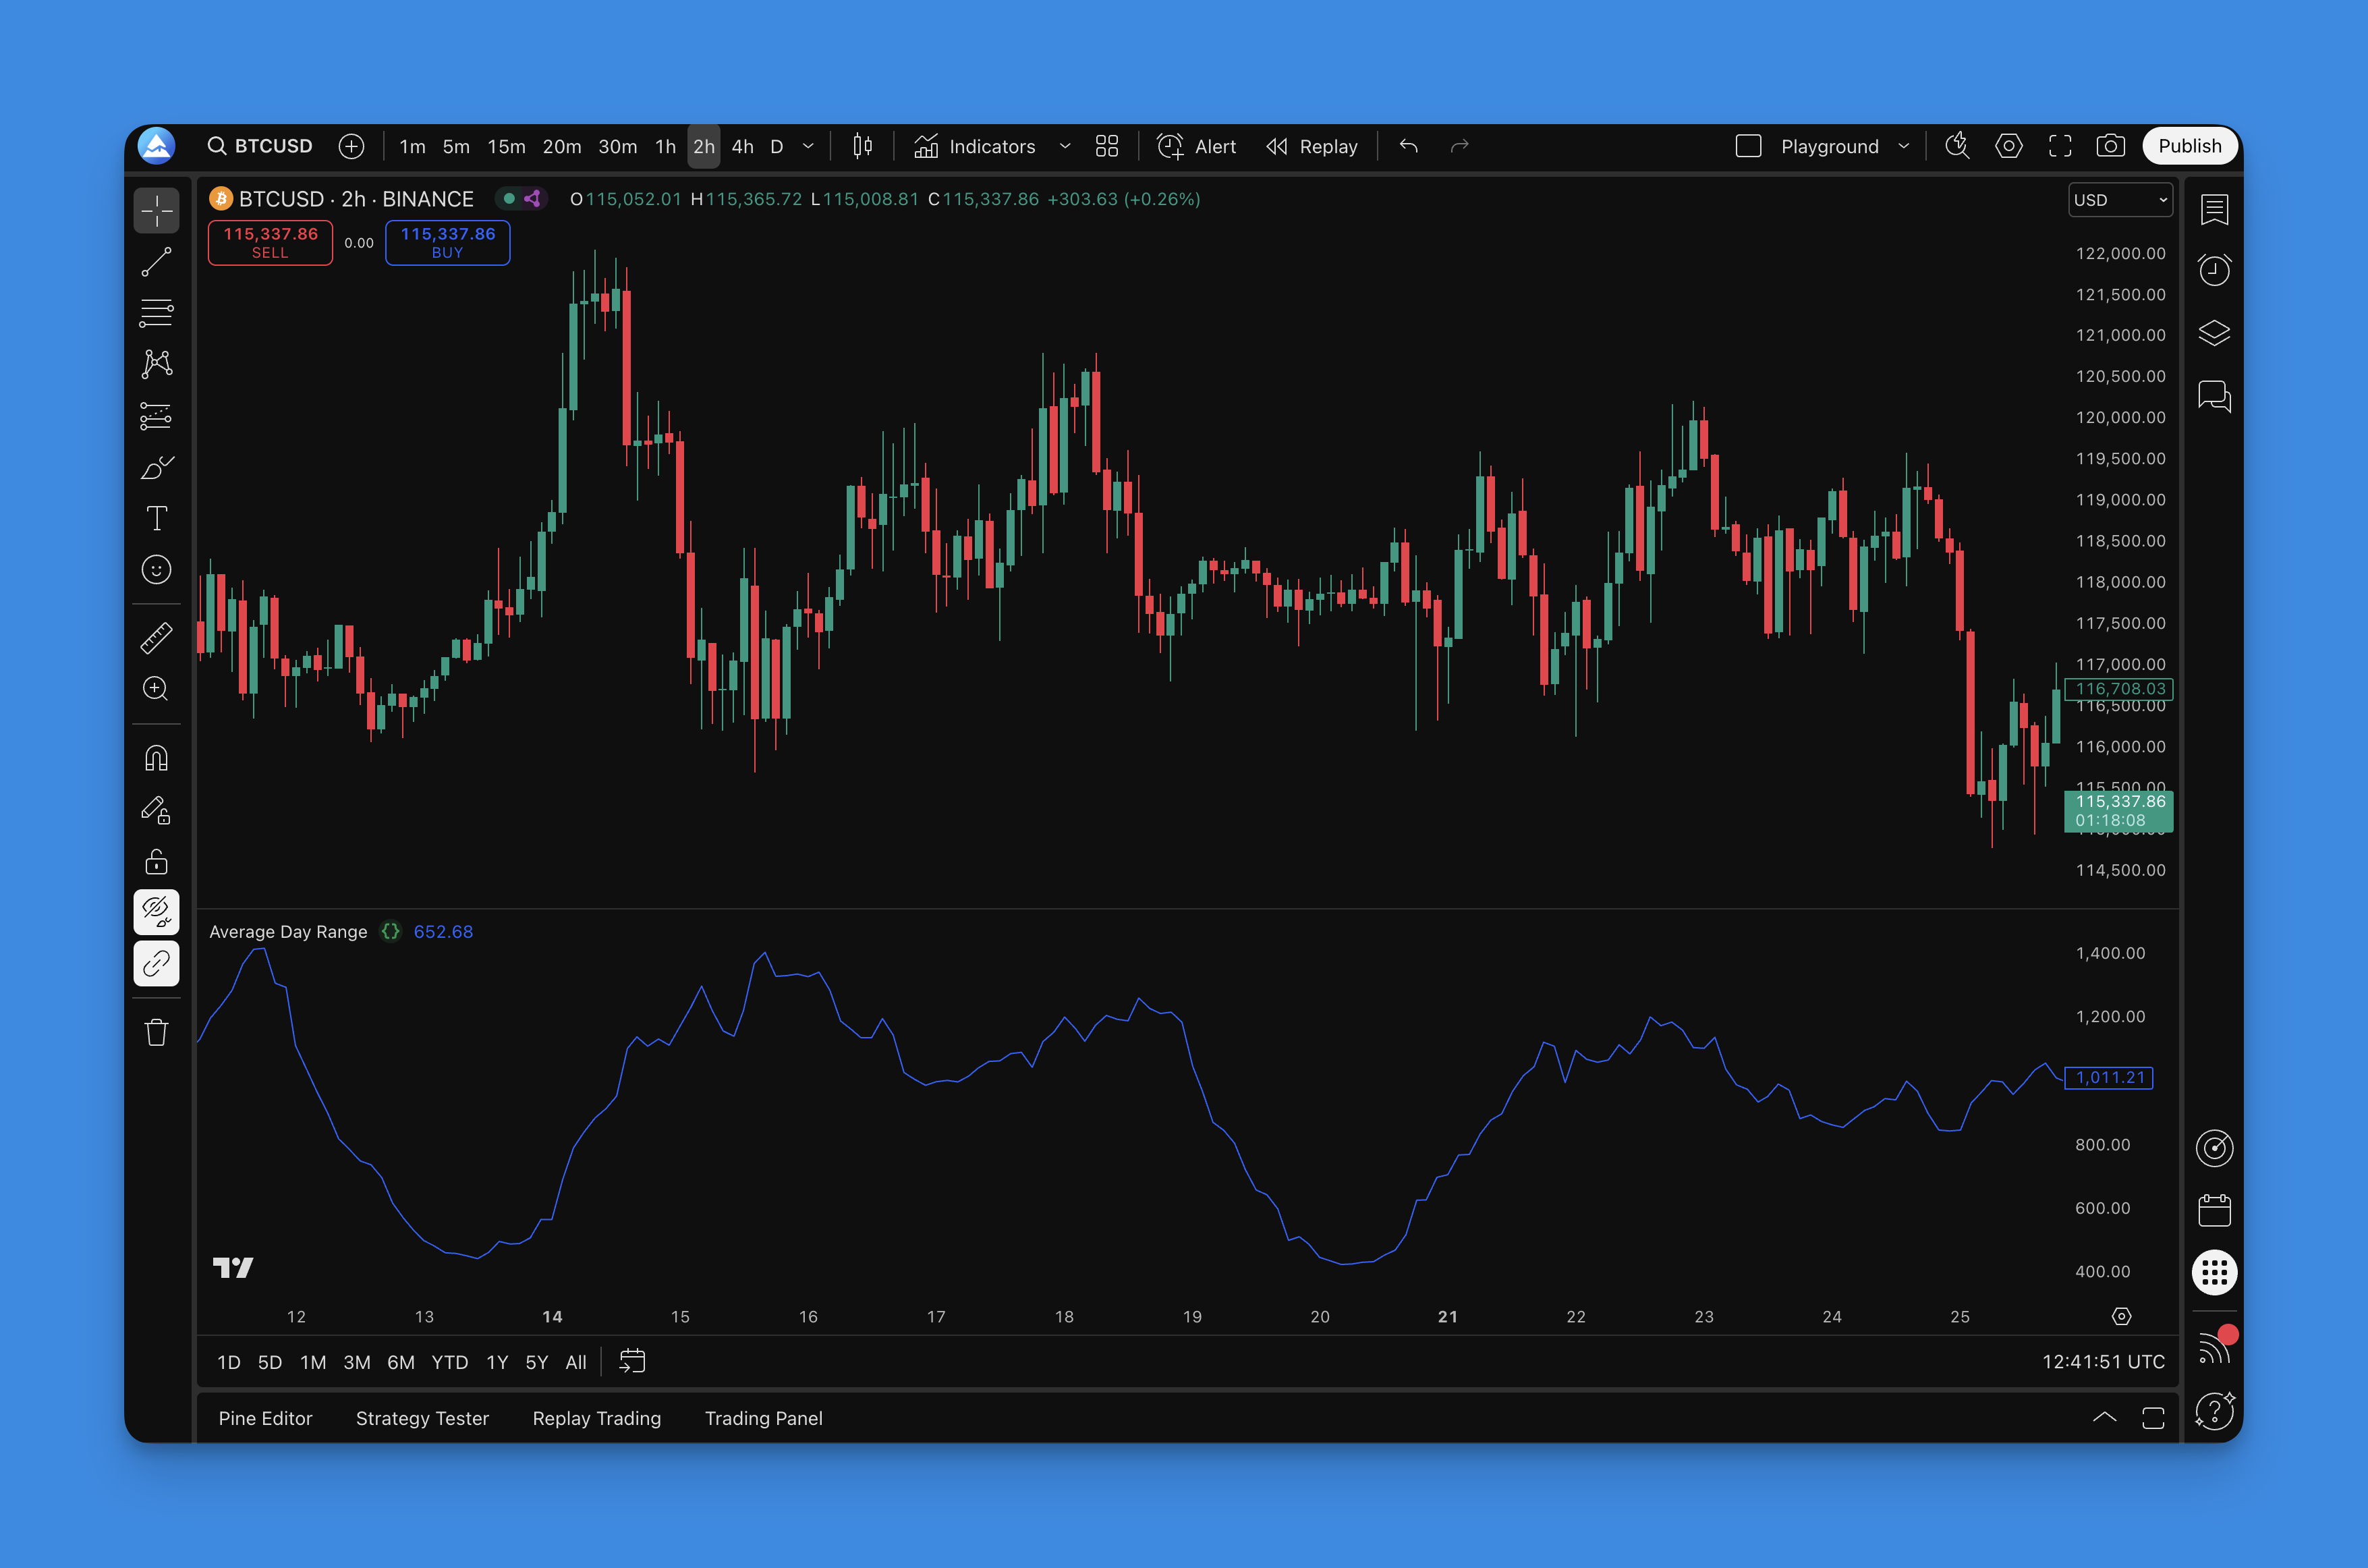
Average Day Range Indicator: Better Risk Management on TradingView

· 12 min read
Pineify Team
Pine Script and AI trading workflow research team

The Average Day Range (ADR) indicator measures how much an asset typically moves in a single session. Take TSLA — I've been tracking it since March 2025, and on a normal day it swings about $12 to $15 between high and low. When I saw ADR spike to $28 on April 3, 2026, I knew something was off before the earnings miss hit the news. That's what ADR gives you: a volatility benchmark that actually means something.

Most traders I know jump straight to RSI or MACD. I've done that too. But ADR is the one I check first now, because it tells me what the market is doing instead of what it already did. It's not complicated — you don't need a math degree or a PhD in quantitative finance.

Average Day Range Indicator

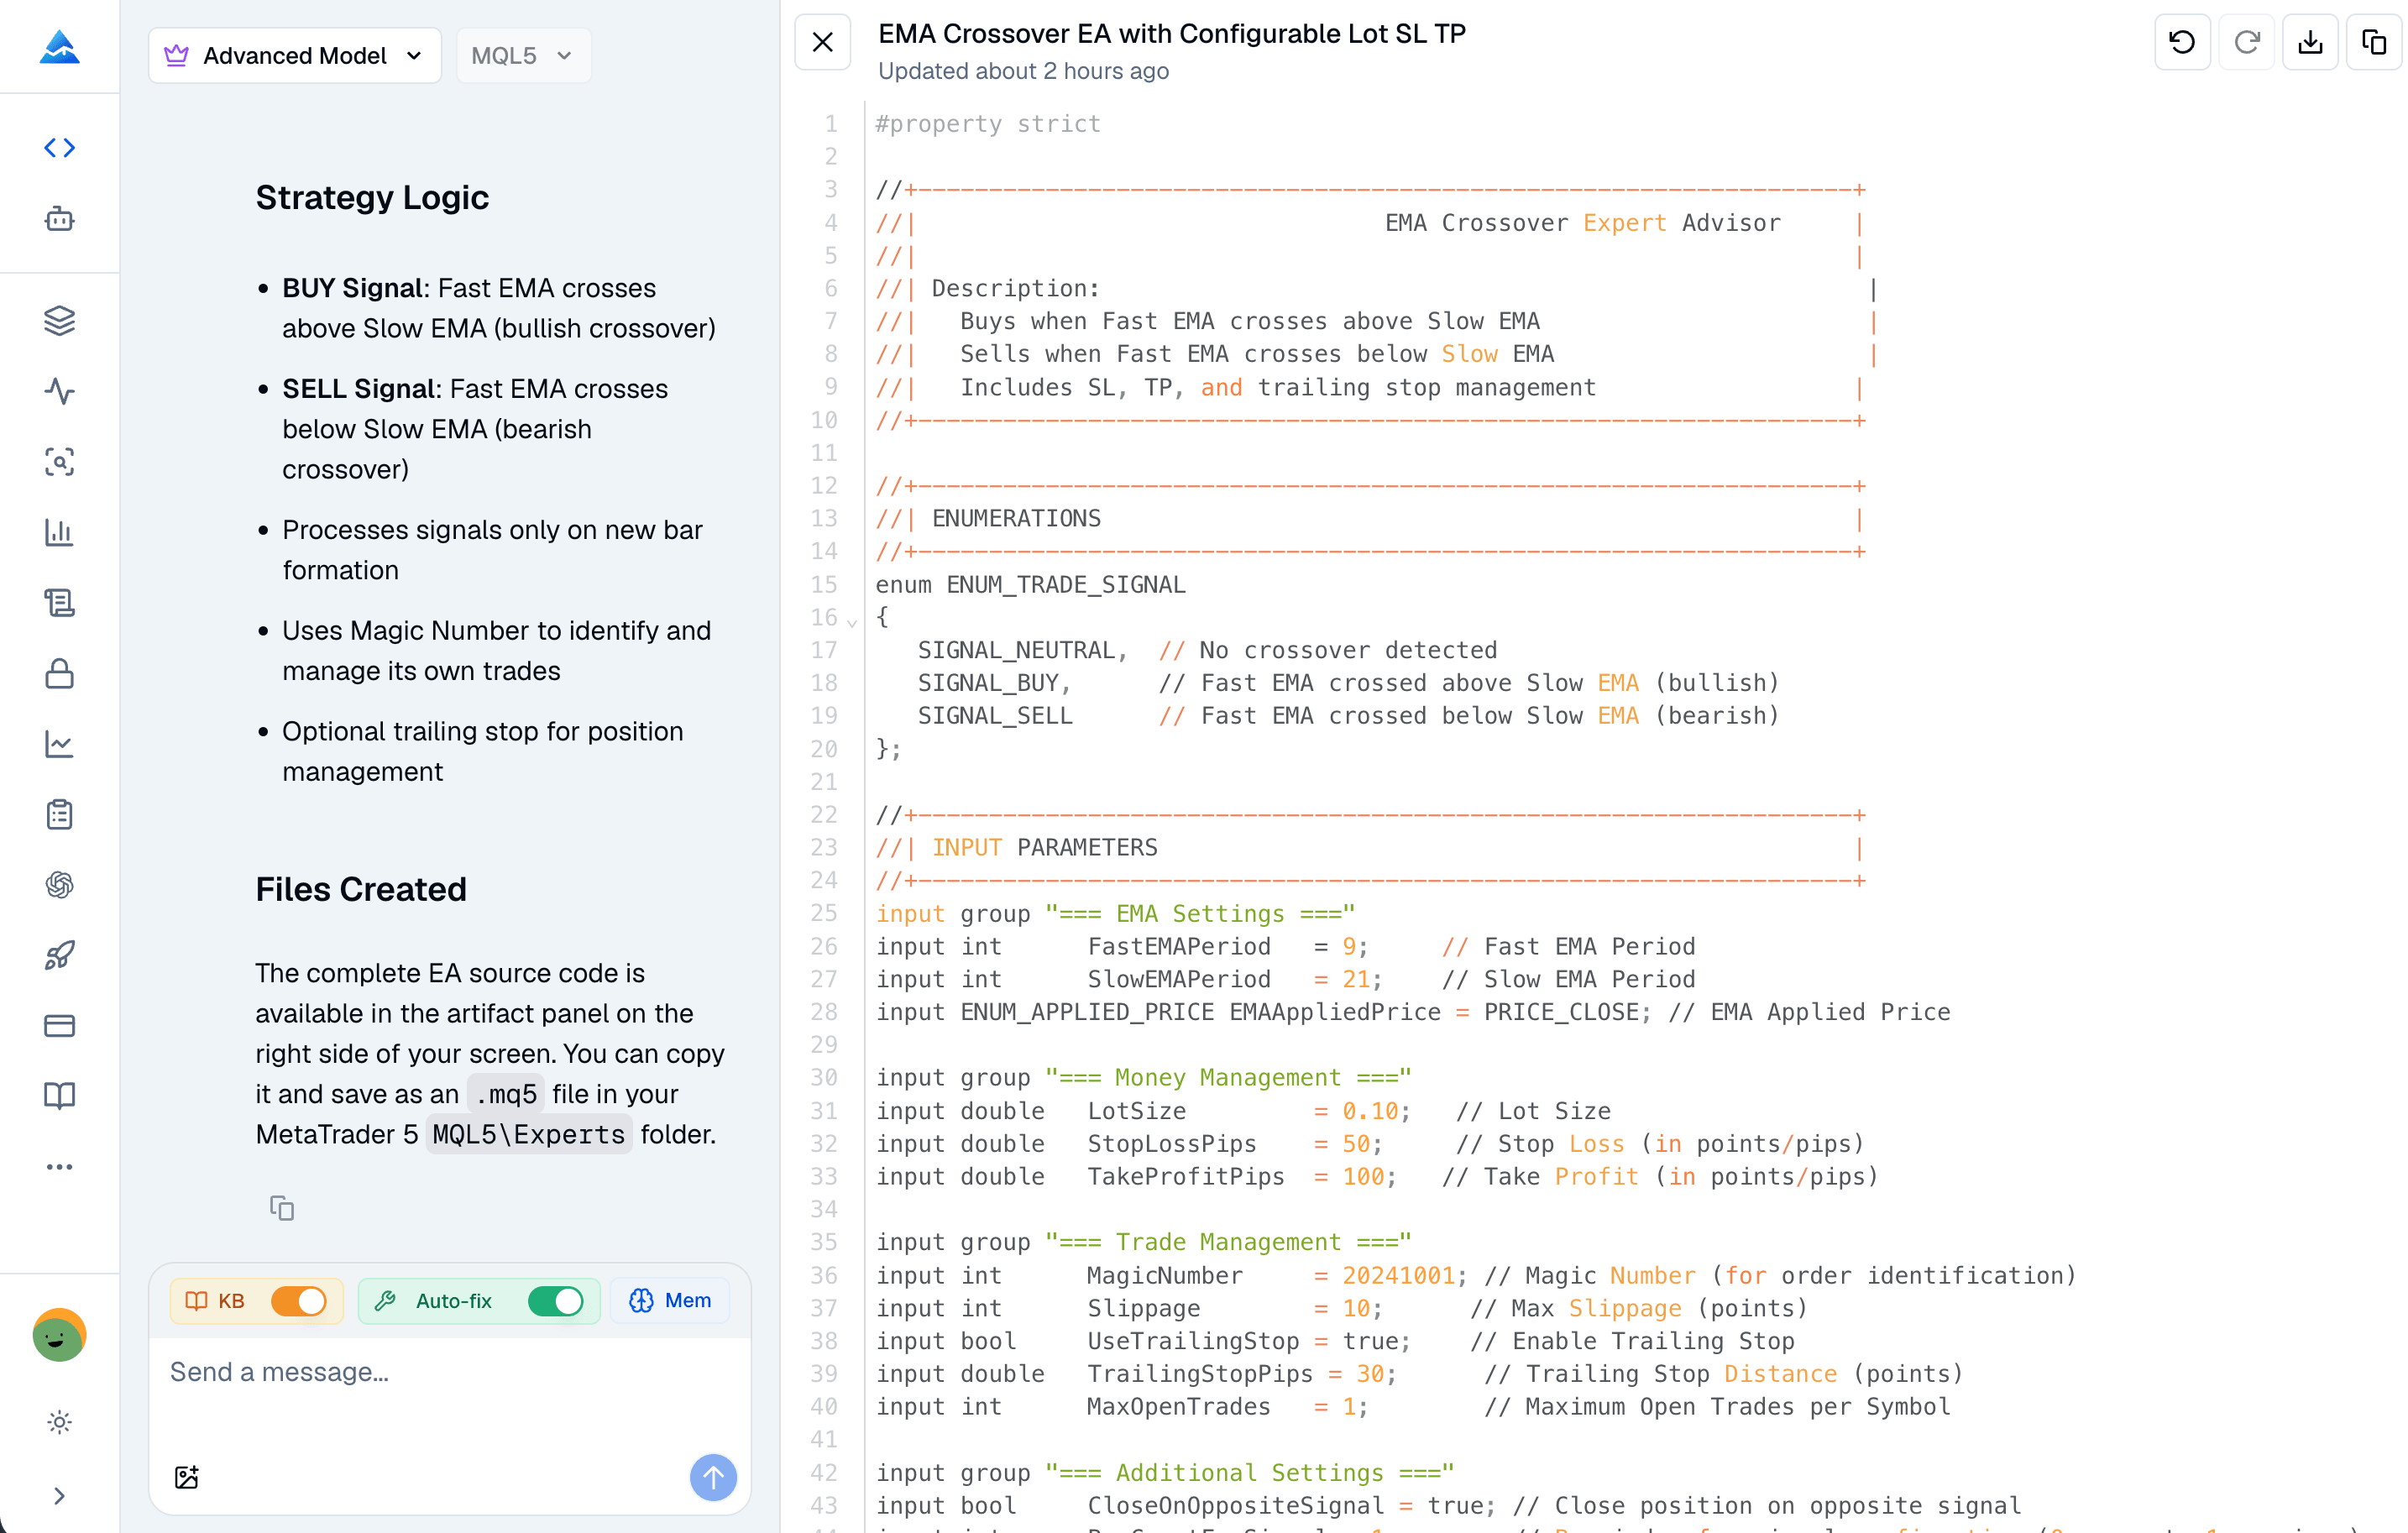
Convert MQL4 to MQL5: A Practical Migration Guide for Traders

· 13 min read
Pineify Team
Pine Script and AI trading workflow research team

If you've been running automated trading strategies on MetaTrader 4, you've probably heard the news: brokers are slowly moving away from MT4, and MetaTrader 5 (MT5) is taking over. MQL4 to MQL5 conversion is the process of migrating MetaTrader 4 code — Expert Advisors, custom indicators, and scripts — to work on the MetaTrader 5 platform. That means you'll need to convert MQL4 to MQL5, and the sooner you start, the smoother the transition.

I've converted about a dozen EAs from MQL4 to MQL5 this year alone, and the order management refactoring tripped me up every single time until I switched to the CTrade class. Some of those EAs ran on EURUSD with scalping logic, and getting the position sizing right took multiple passes.


Convert MQL4 to MQL5: The Complete Trader's Guide for Migration

Awesome Oscillator Indicator: Momentum Changes on TradingView

· 11 min read
Pineify Team
Pine Script and AI trading workflow research team

The Awesome Oscillator is a momentum indicator created by Bill Williams that compares short-term price velocity to its medium-term counterpart. I'll be honest - when I first stumbled across this thing, I thought the name was pure marketing fluff. After running it on AAPL and TSLA daily charts for the past two years, it's become one of my most reliable tools.

Here's the math: AO = SMA(5) of midpoint - SMA(34) of midpoint. Midpoint is just (high + low) / 2. Think of it like checking your car's acceleration - you'll know if you're speeding up or slowing down before the speedometer moves. Green bars mean momentum is building. Red bars? Things are cooling off.

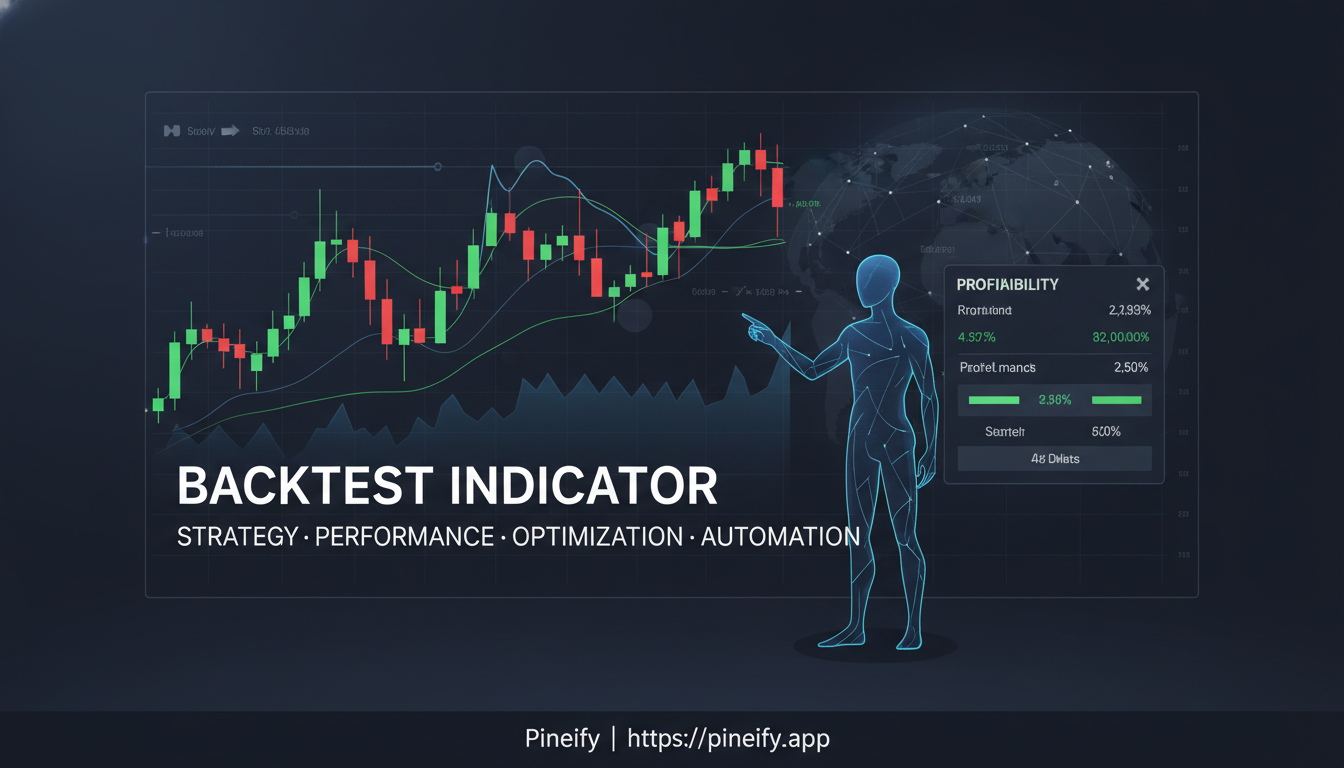
Backtest Indicator on TradingView: Test Any Strategy Reliably

· 20 min read
Pineify Team
Pine Script and AI trading workflow research team

Backtesting is the process of running a trading strategy against historical market data to see how it would have performed. On TradingView, it's like having a time machine for your strategies. You get to see how your approach would have played out in the past, so you can build confidence before putting real money on the line. TradingView offers two ways to do this: manually step through old market data with Bar Replay, or set up an automated Pine Script strategy to run the tests for you. Both methods produce detailed reports that reveal the strengths and weaknesses of your plan.

I spent a weekend backtesting an EMA crossover on AAPL across 5 years of data. The net profit looked solid, but the max drawdown was bigger than I'd accept for my account size.

Backtest Indicator TradingView: Complete Guide to Testing Your Trading Strategies

Backtesting.py: How to Backtest Trading Strategies in Python

· 15 min read
Pineify Team
Pine Script and AI trading workflow research team

I've tested dozens of trading strategies over the past few years, and backtesting.py is the library I keep coming back to. It's free, it runs fast, and you can simulate trades against historical data before risking a single dollar. Whether you're checking a simple moving average strategy or a more complex algorithmic idea, this library gives you a direct way to see how that idea might have performed — and where it might fall apart.

Backtesting.py vs Backtrader vs Pineify: Best Backtesting Platform

· 23 min read
Pineify Team
Pine Script and AI trading workflow research team

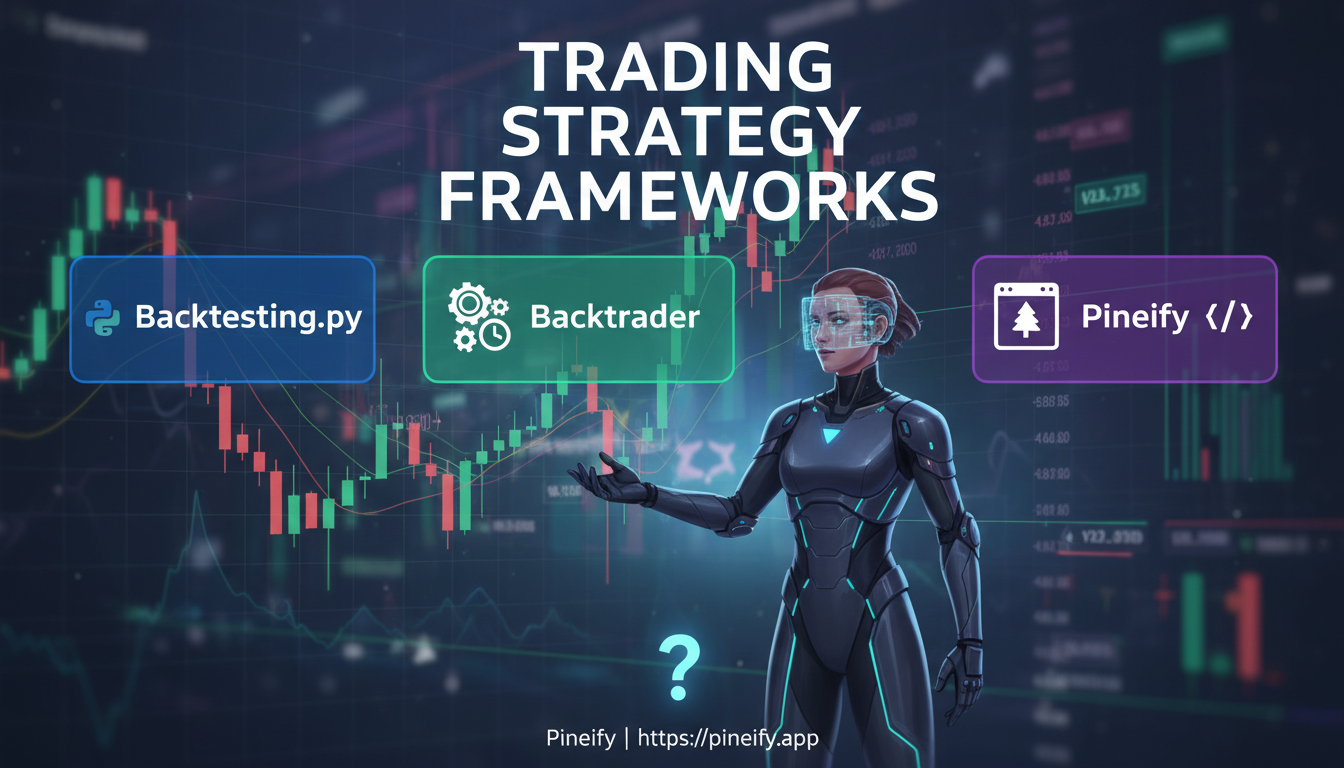
Backtesting is the process of running a trading strategy against historical market data to see how it would have performed. Backtesting.py, Backtrader, and Pineify take three different approaches to this problem. My verdict: if you already know Python, start with Backtesting.py. If you need professional-grade control and multi-asset backtesting, Backtrader is worth the learning curve. If you use TradingView and don't want to write code, use Pineify. I've tested all three on an EMA crossover strategy on AAPL from 2021-2024, and each one gave me slightly different results because of how they handle data alignment and slippage.

Backtesting.py vs Backtrader vs Pineify: Choose Your Best Trading Strategy Testing Platform

Backtesting.py vs Backtrader vs Pineify: Which Backtesting Fits You?

· 16 min read
Pineify Team
Pine Script and AI trading workflow research team

Backtesting is running a trading strategy against historical price data to measure how it would have performed. I've tested strategies on Backtesting.py, Backtrader, and Pineify across dozens of projects since 2022, and each one serves a fundamentally different purpose. My verdict: start with Backtesting.py for speed, graduate to Backtrader when you need production features, and add Pineify if you already live in TradingView. Pick the wrong framework and you'll spend more time fighting the tool than testing your ideas.

Backtesting.py vs Backtrader vs Pineify: Which Framework is Right for Your Trading Strategy?