Up Down Volume Ratio: What Volume Reveals About Stock Strength

· 15 min read
Pineify Team
Pine Script and AI trading workflow research team

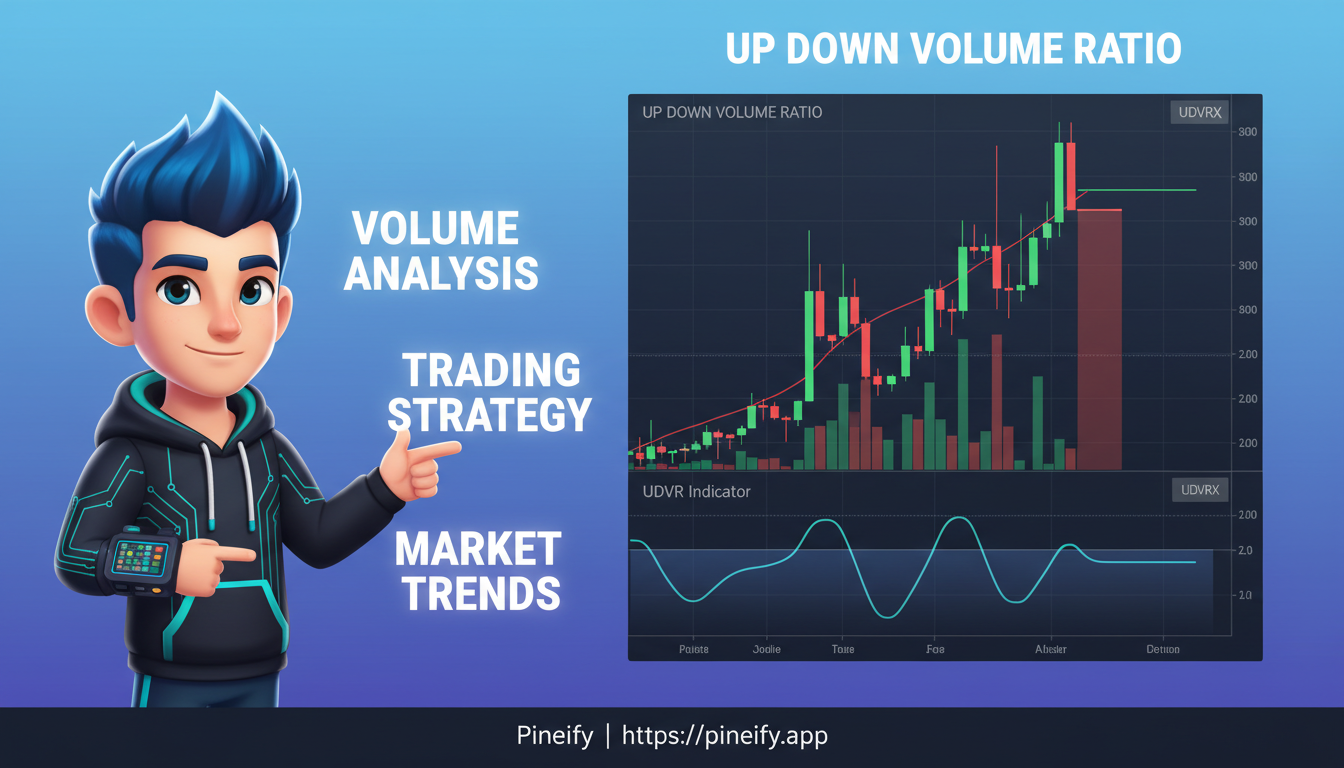
The Up Down Volume Ratio (UDVR) is a TradingView momentum indicator that compares total trading volume on up days against total volume on down days over a specific lookback period. A ratio above 1.0 means more volume flowed on green days; below 1.0 means sellers drove the heavier sessions. If you swing trade or follow CANSLIM-type setups, this gauge helps spot where institutional money is building positions versus quietly exiting them.

Up Down Volume Ratio TradingView: Complete Guide to Master This Powerful Indicator

Uptrick Indicator TradingView: Adaptive ATR Trailing Stops Explained

· 15 min read
Pineify Team
Pine Script and AI trading workflow research team

You know that frustrating feeling when your trailing stop gets hit during normal volatility, only to watch the trend continue without you? Or when you hold too long and give back most of your profits? The Uptrick Indicator solves both problems by adapting to what the market is actually doing right now.

Pineify Website

UT Bot Indicator: ATR Trailing Stop for TradingView Pine Script

· 13 min read
Pineify Team
Pine Script and AI trading workflow research team

Ever stared at a chart wondering when to get in or out of a trade? The UT Bot indicator might be exactly what you need. I've been running this on my daily charts for about six months, and it's become a core part of how I follow trends. Back in March 2025, I tested it on AAPL and it caught a 15% rally I would have missed with my old system.

The UT Bot is an ATR-based trailing stop system. The ATR (Average True Range) adapts the stop distance to whatever the market is doing right now. When price breaks above the trailing line, you get a buy signal. Break below, and it's time to sell. The bar coloring -- green for uptrends, red for downtrends -- makes it readable at a glance.

Visual Pine Script Editor vs Tickeron: Build TradingView Strategies

· 15 min read
Pineify Team
Pine Script and AI trading workflow research team

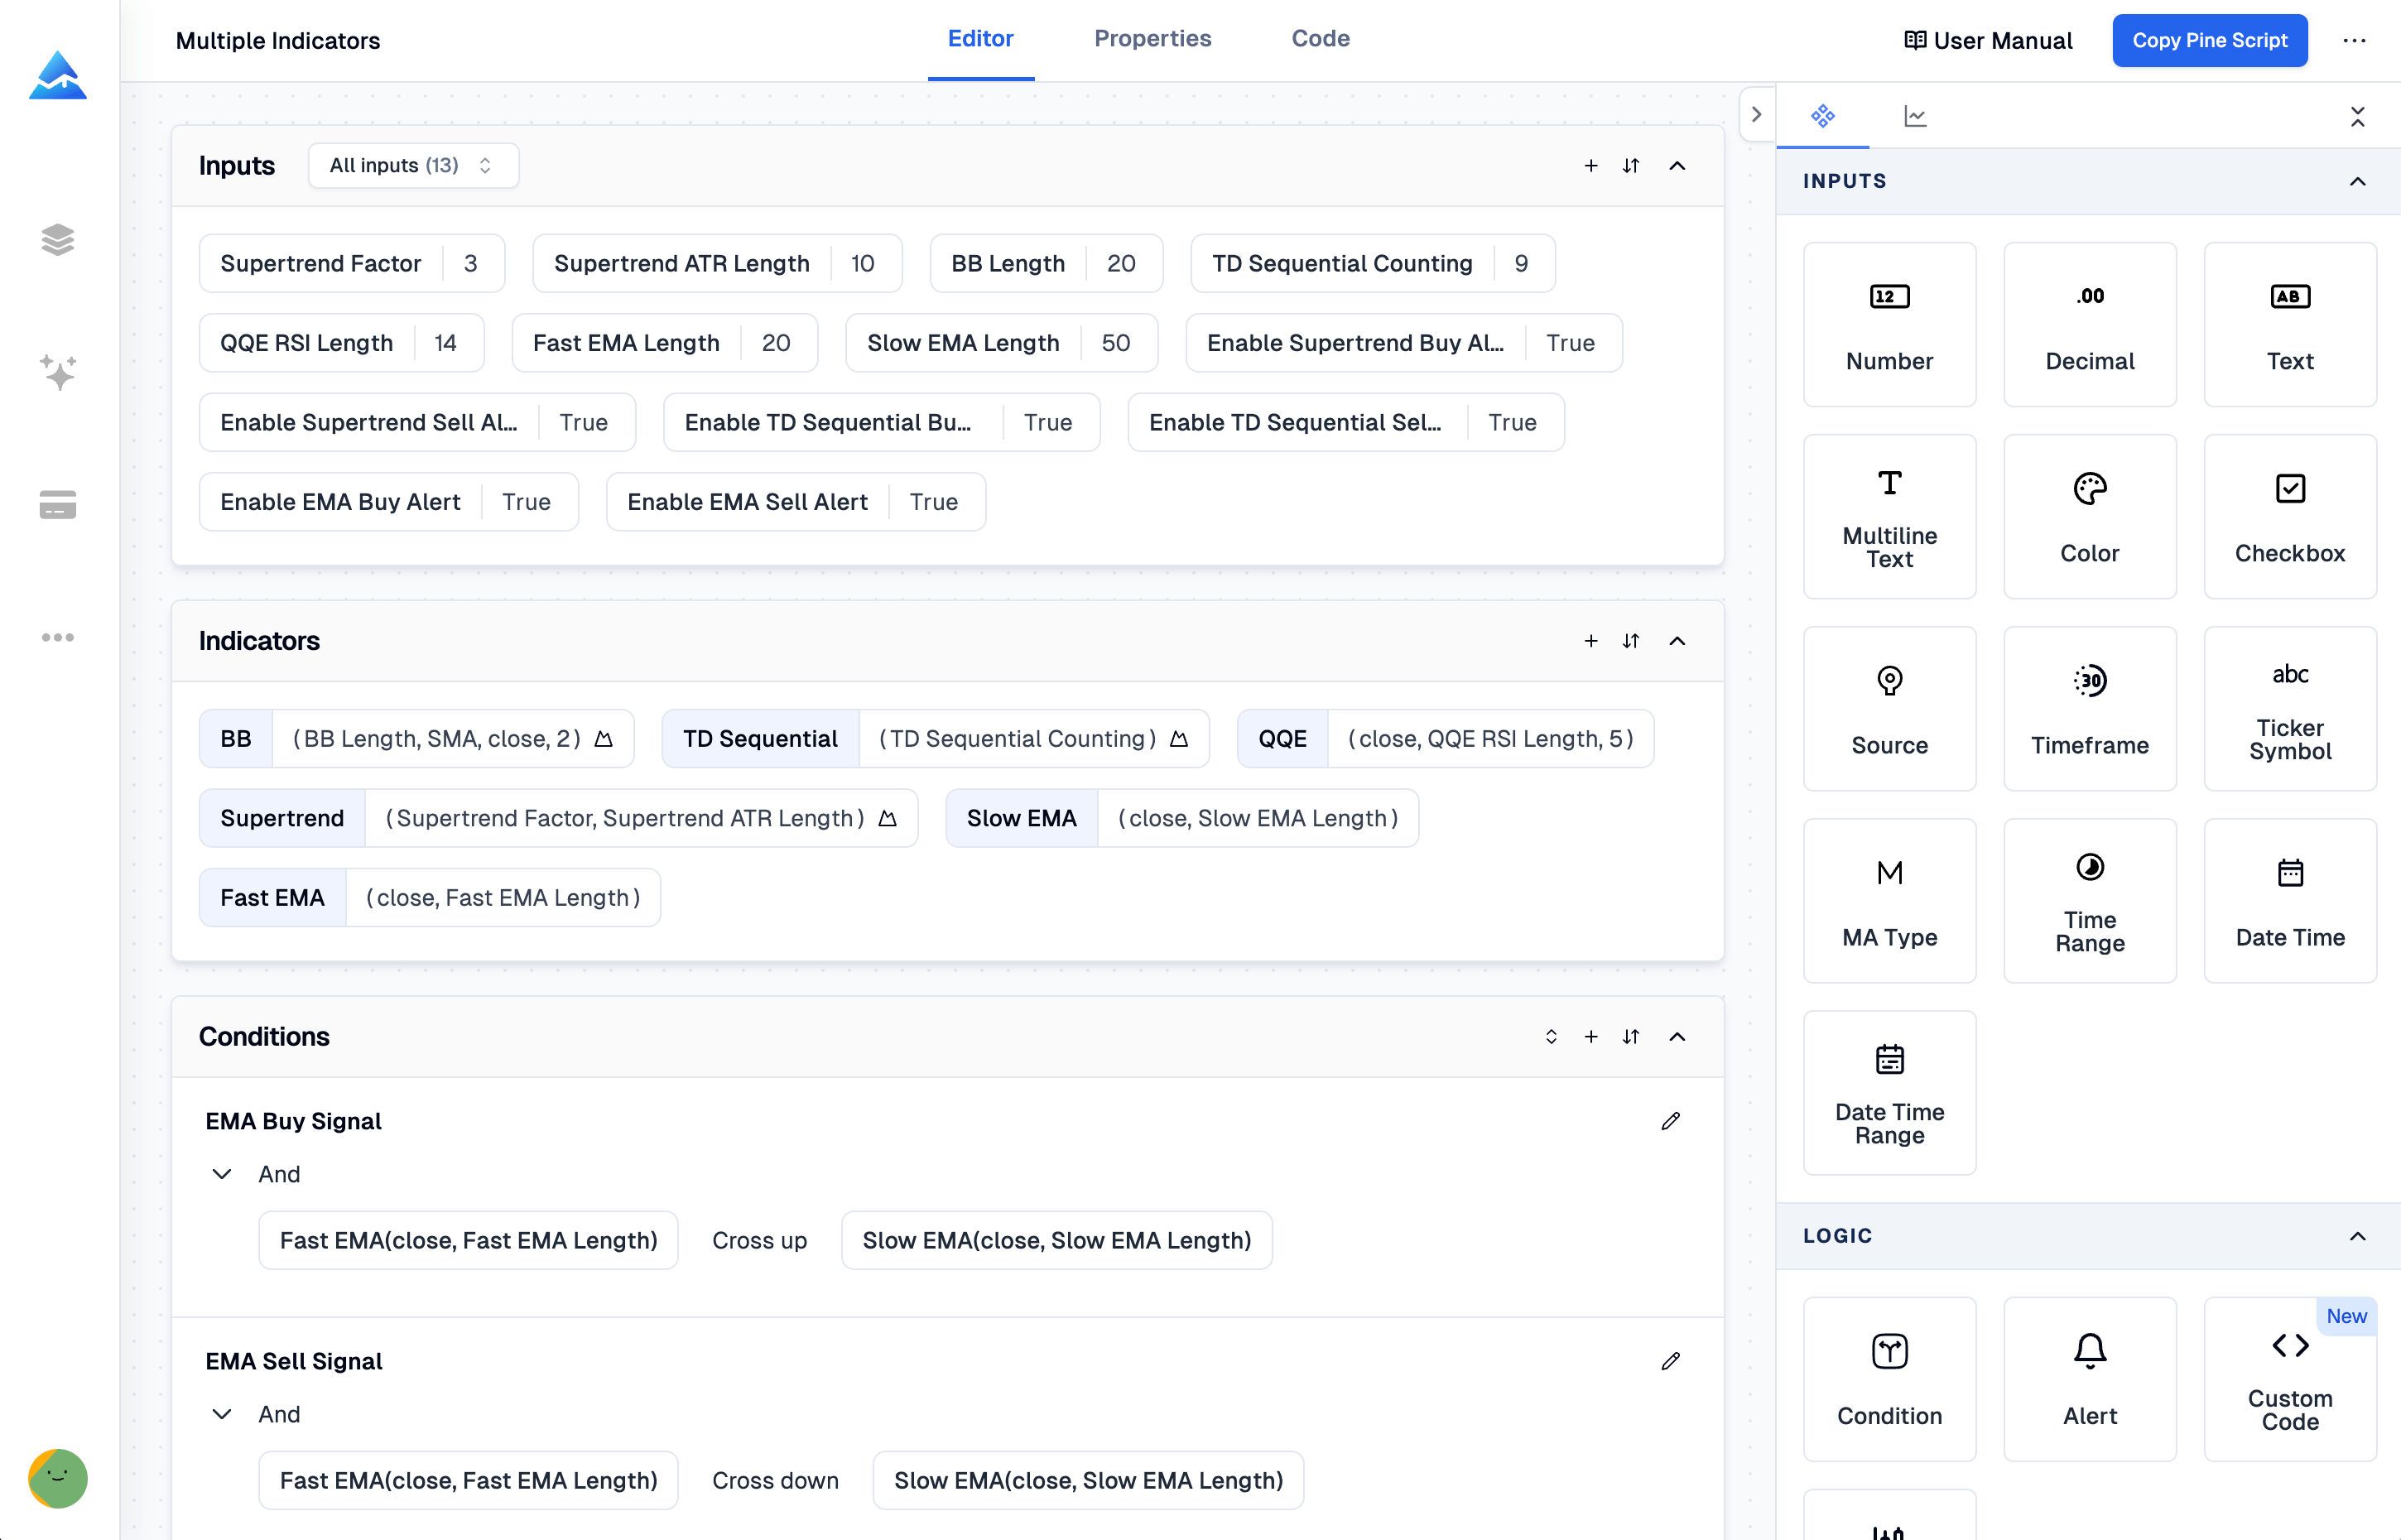
A visual Pine Script editor is a no-code interface where traders build TradingView indicators and strategies by connecting logic blocks instead of writing code. Between Tickeron and Pineify's Visual Pine Script Editor, the verdict is straightforward: Tickeron sells you signals you can't modify, while Pineify lets you build the system that generates those signals. I've spent months testing both, and they're not really competitors — they serve completely different stages of a trader's journey.

If you've been trading a while, you've probably seen Tickeron's ads — AI pattern recognition, ready-made signals, solid reviews on Trustpilot. It's a fine starting point. But at some point you want to build your own thing. Own it completely. That's where most visual tools fall short.

Visual Pine Script Editor vs Tickeron: Build Custom TradingView Strategies Without Code

Volatility Adjusted Moving Average (VAMA) Indicator for TradingView

· 16 min read
Pineify Team
Pine Script and AI trading workflow research team

VAMA is an adaptive moving average indicator that adjusts its sensitivity based on current market volatility. It measures price deviation from a baseline EMA and becomes more responsive when volatility spikes, then smooths out when markets calm down.

Look, I've been trading for over a decade, and nothing frustrated me more than watching my simple moving averages get demolished during volatile market sessions. You know the drill - your SMA works great during smooth trends, then volatility kicks in and you're getting whipsawed left and right.

Most traditional moving averages are blind to market conditions. They calculate the same way whether it's a meltdown or a sleepy sideways crawl. That's where VAMA comes in - it recognizes when markets are going crazy and adjusts accordingly.

I've spent months testing VAMA across EURUSD, BTCUSD, and AAPL. I ran it on the August 2024 volatility spike in the Nikkei and caught the reversal before my standard EMA even flinched. Honest opinion? It delivers on its promise - cleaner signals, fewer false breakouts, and better trend identification.

Volatility Stop Indicator TradingView: Dynamic ATR Stop Loss Strategy

· 12 min read
Pineify Team
Pine Script and AI trading workflow research team

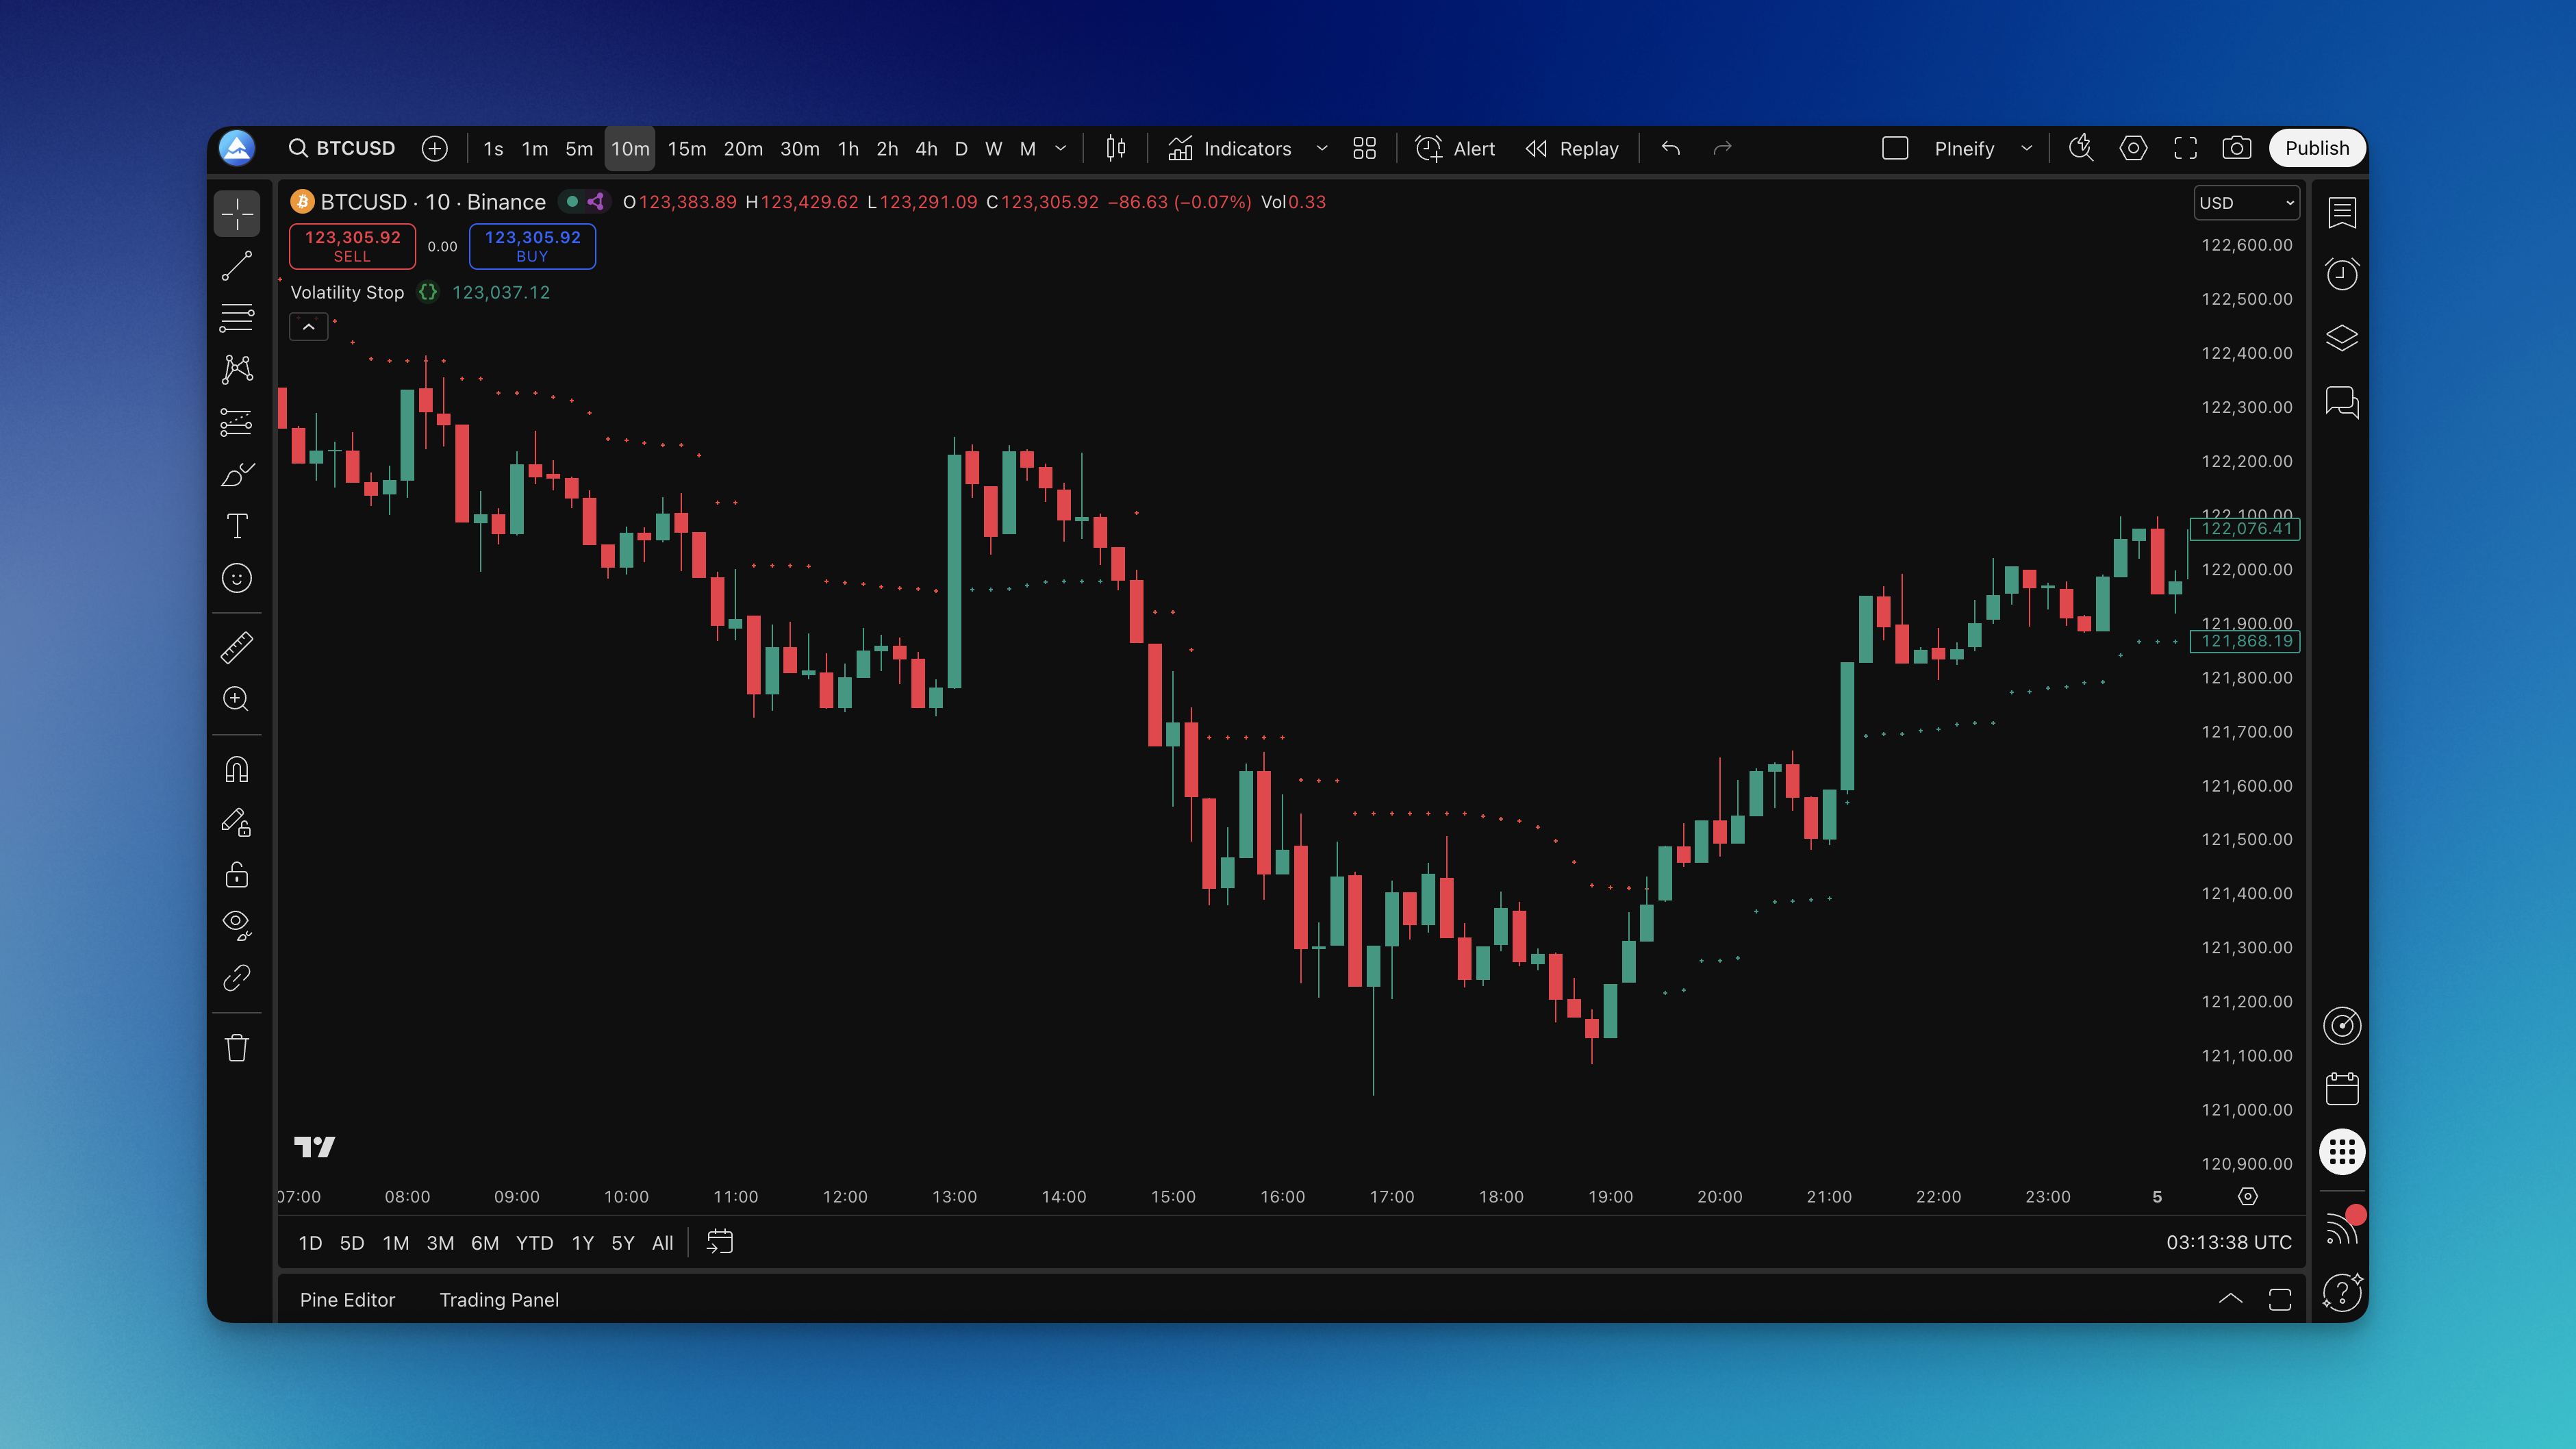
The Volatility Stop indicator is an ATR-based dynamic stop loss for TradingView that expands and contracts with market conditions. Instead of a fixed percentage that ignores what's actually happening, it reads the market's pulse through Average True Range and positions your stop accordingly.

I ran this on AAPL daily charts from January to June 2024 using the default 20-period ATR with a 2.0 multiplier. The stop survived the March 5th volatility spike — a day where AAPL dropped 2.8% intraday — without triggering. A fixed 2% stop would have knocked me out. Price recovered and rallied another 7% over the next three weeks. That's the difference between dynamic and static.

On NVDA I've settled on a 24-period ATR with a 2.5 multiplier since September 2023. NVDA moves sharper than most tickers, and the tighter 2.0 multiplier kept giving me premature exits during post-earnings gaps. The wider setting fixed that. But I haven't tested it on low-volatility pairs like EURGBP, and I suspect the wider stops would be overkill there.

Volatility Stop Indicator on Chart

Volume SuperTrend AI Indicator: Filter False Signals on TradingView

· 15 min read
Pineify Team
Pine Script and AI trading workflow research team

Ever watch your SuperTrend indicator flip from green to red and back again like it can't make up its mind? Meanwhile, your account balance keeps shrinking with each whipsaw. I get it - I've lost money on those same false signals.

Regular SuperTrend indicators only care about price. They ignore volume - like judging a party's energy by only looking at the room size, not how many people are actually there.

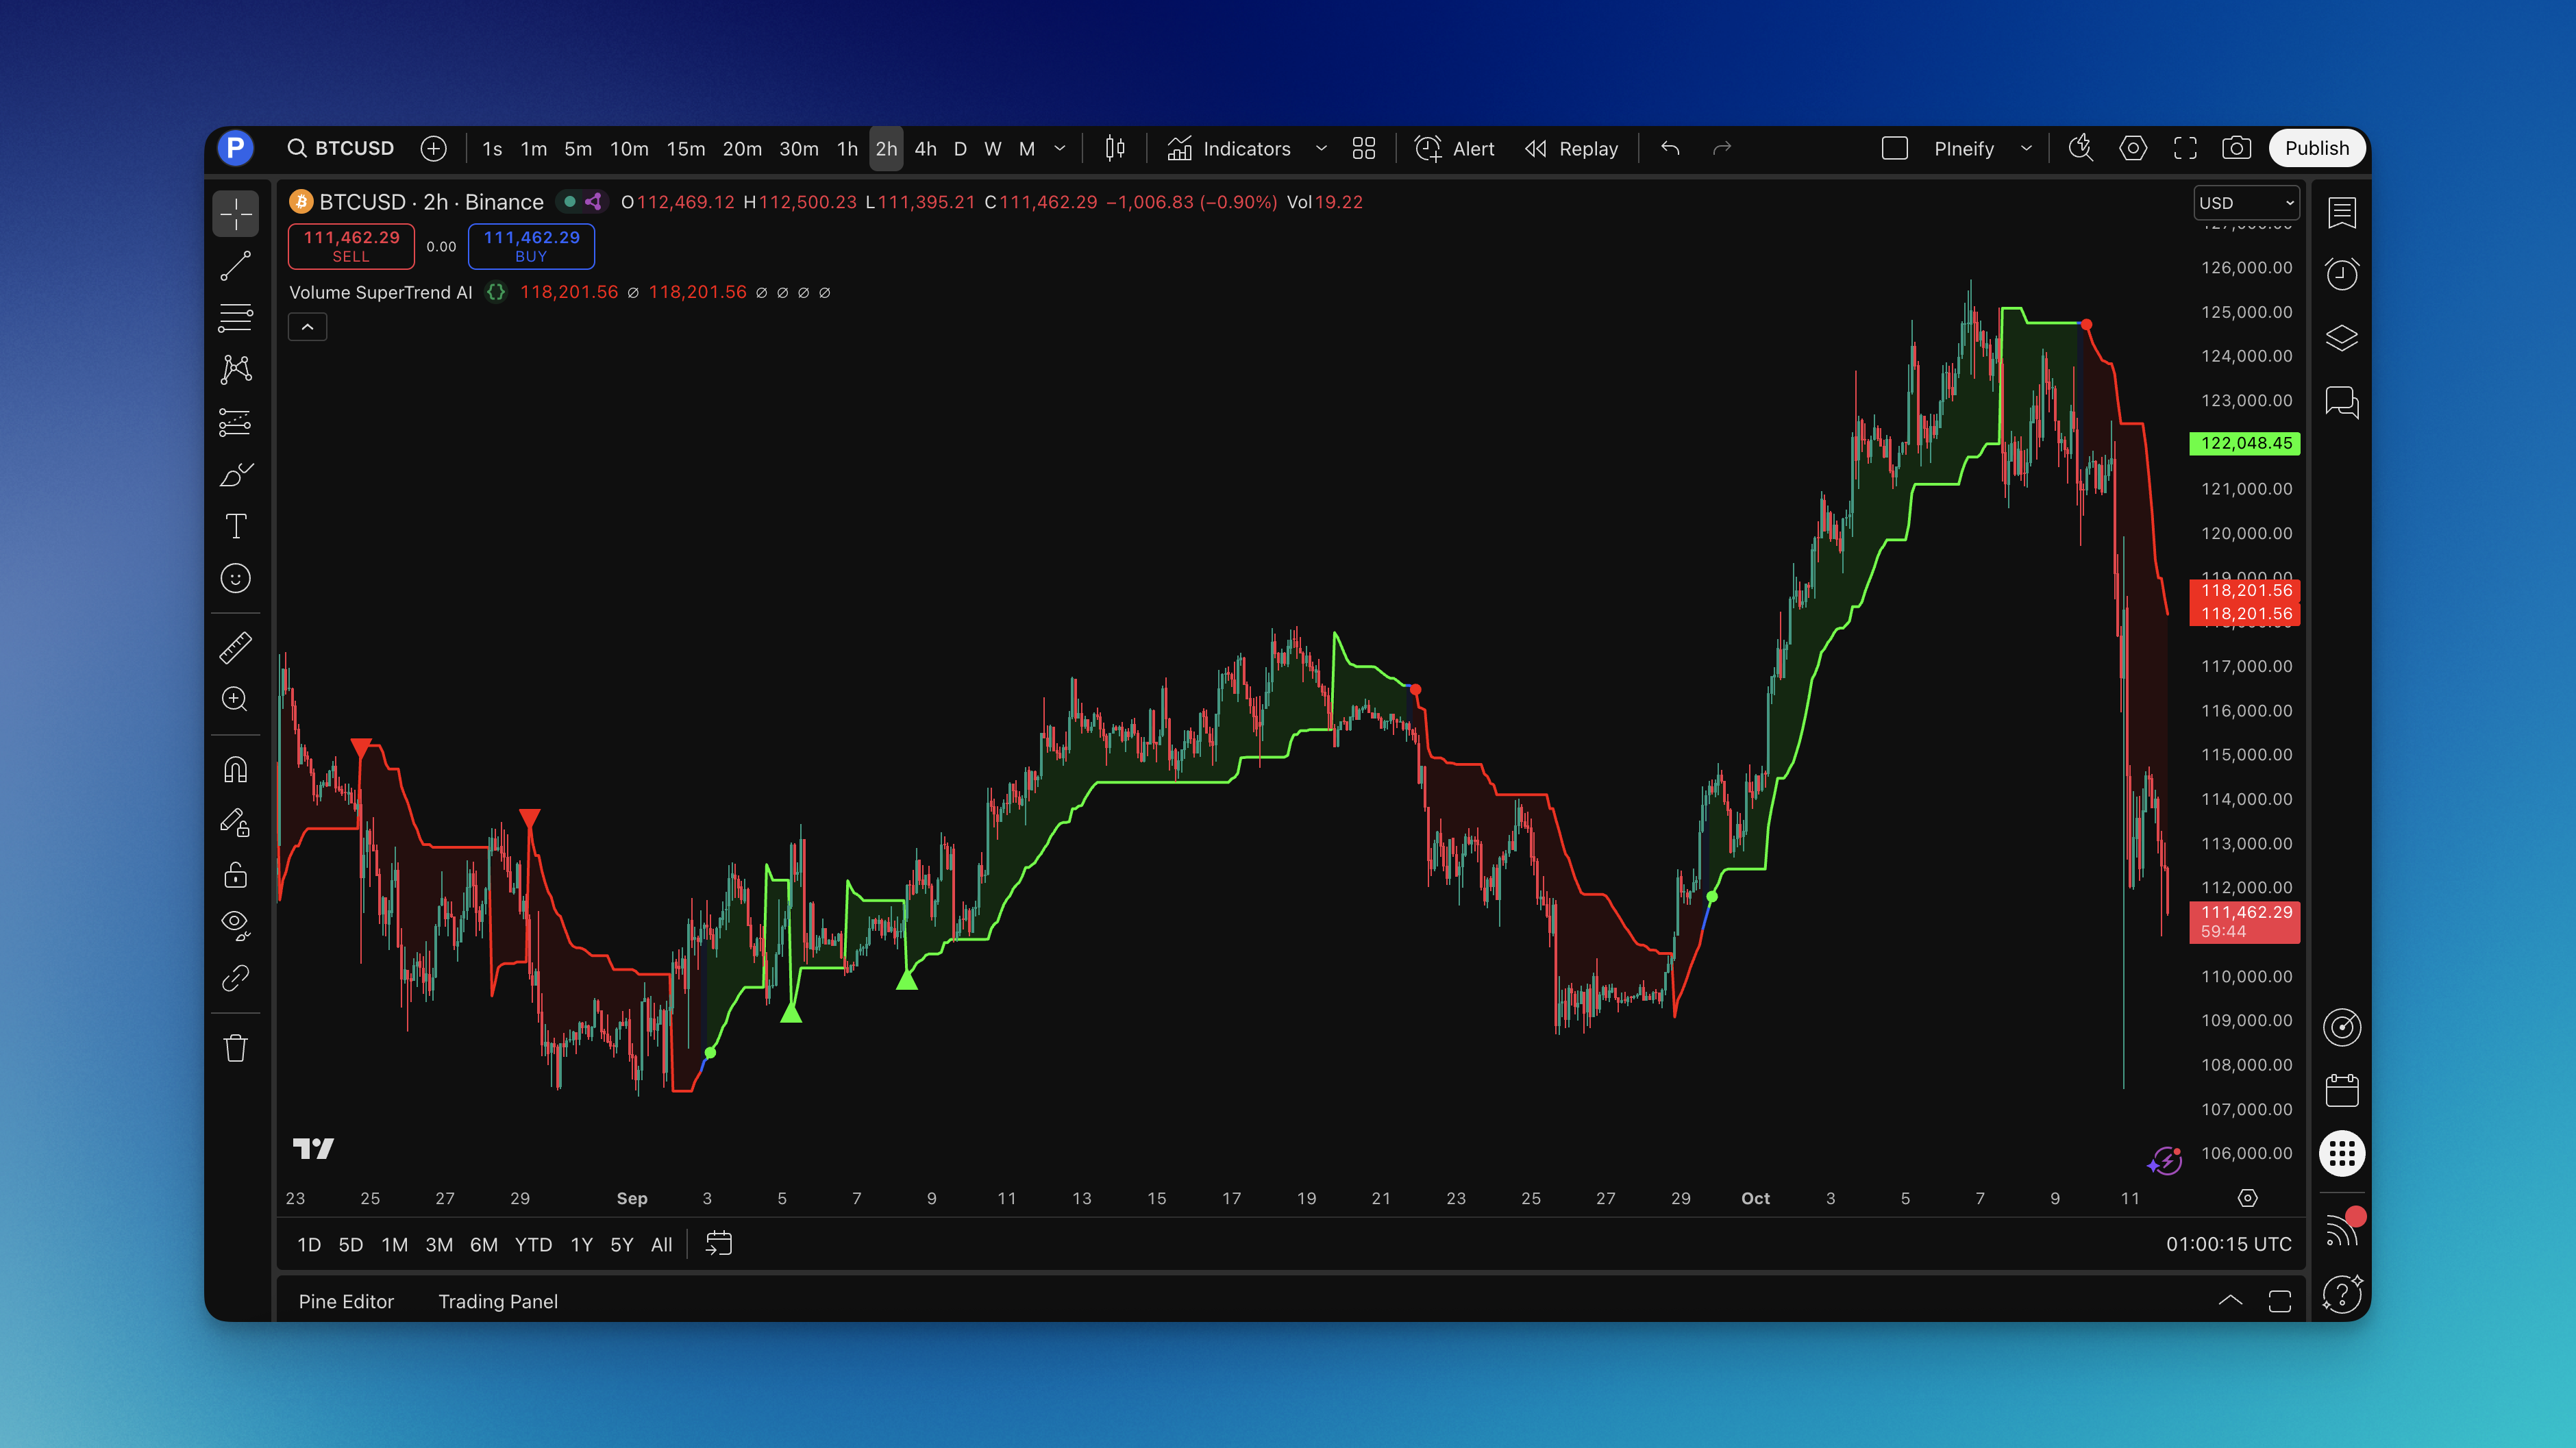
The Volume SuperTrend AI indicator is a KNN machine learning trend filter that weighs every price move by how much volume traded behind it, then classifies whether the signal is worth your money or just market noise.

Volume SuperTrend AI Indicator - TradingView

VWAP Standard Deviation Bands v2: Support and Resistance Levels

· 12 min read
Pineify Team
Pine Script and AI trading workflow research team

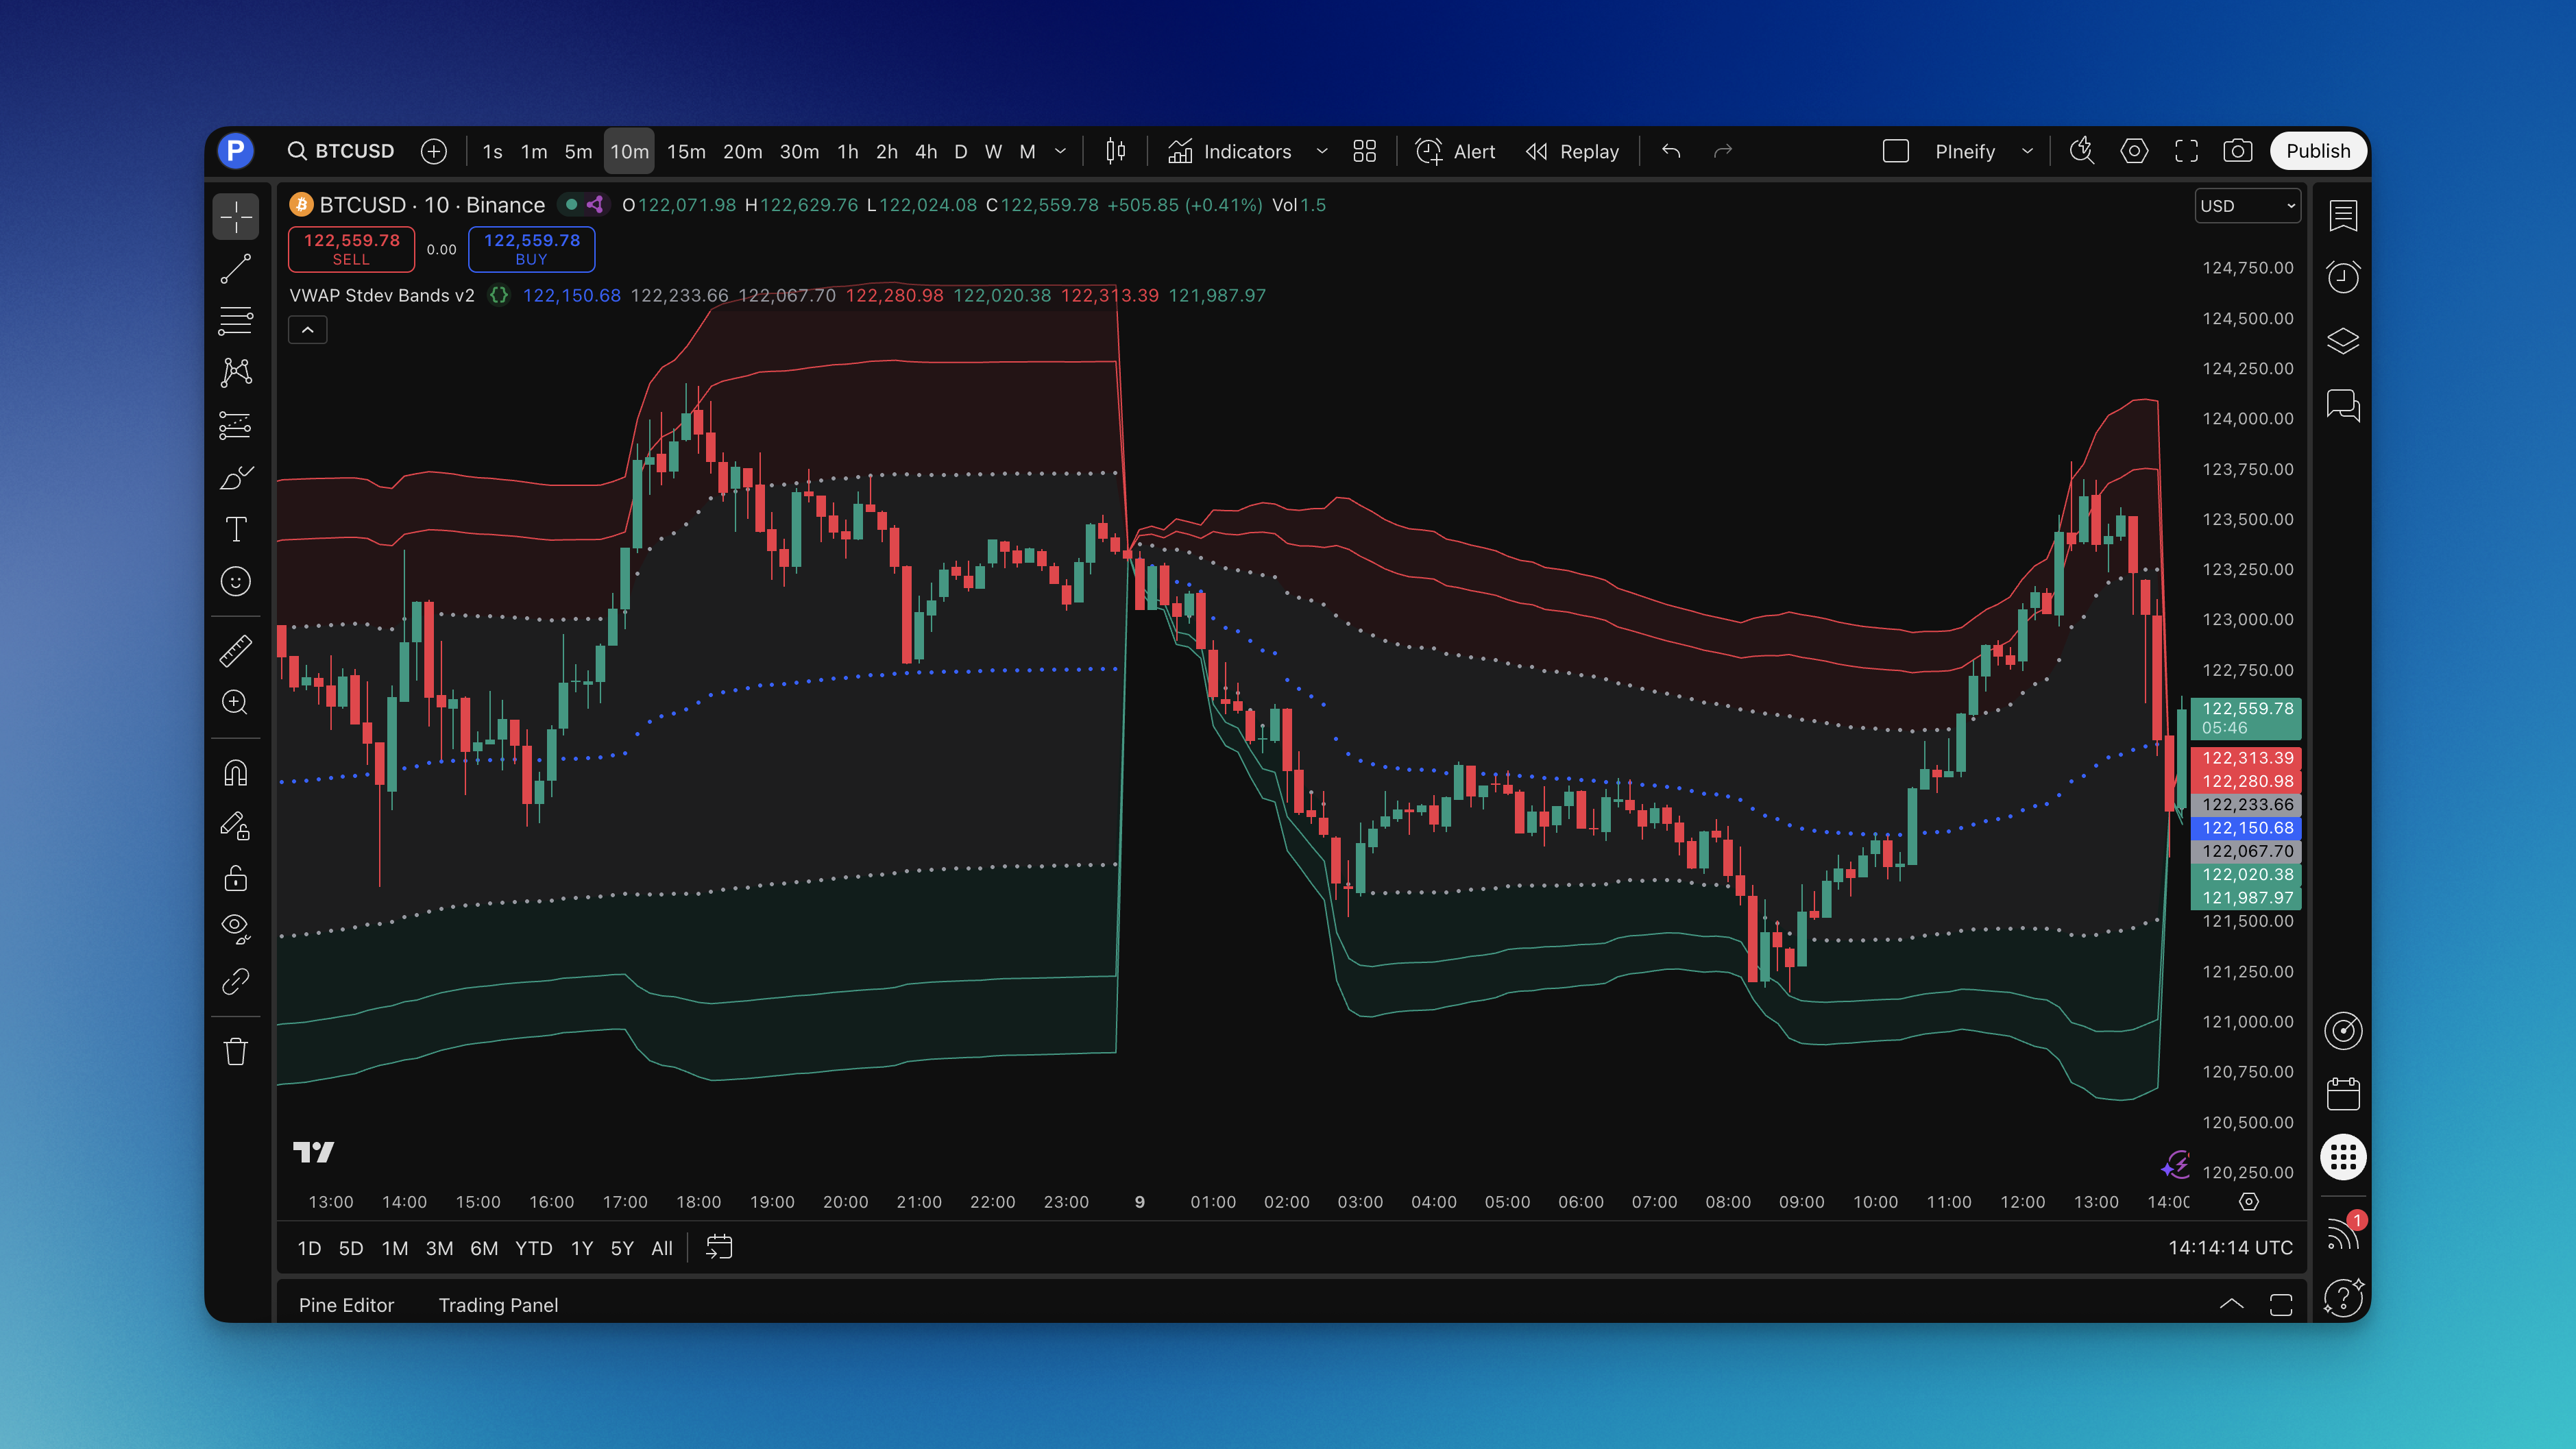
You know that feeling when you're watching a chart and price just seems to bounce off certain levels like there's an invisible wall? That's not magic—it's institutional money at work. VWAP Standard Deviation Bands v2 is a TradingView indicator that plots the volume-weighted average price with five levels of standard deviation bands, turning those invisible walls into visible trading zones.

The VWAP (Volume Weighted Average Price) line acts as the day's "fair value." Add standard deviation bands around it and you get zones that reveal market psychology. Price stretches too far from fair value? It usually snaps back. Price breaks through with conviction? That's your signal that something bigger is happening.

VWAP Stdev Bands v2 Indicator showing multiple standard deviation levels on TradingView chart

VWMA Strategy: Volume-Weighted Moving Average Trading Guide

· 13 min read
Pineify Team
Pine Script and AI trading workflow research team

The Volume-Weighted Moving Average (VWMA) is a moving average that weights each closing price by its corresponding trading volume. High-volume days pull the line further than quiet ones, so the VWMA reflects where the market actually concentrated its activity. A big price move on heavy volume counts. The same move on thin volume barely registers.

I started trading VWMA crossovers on AAPL daily charts in March 2025. The 20-period crossing above the 50-period caught the April 8 breakout at $198 cleanly — something the plain SMA missed by three days. I also tried the same setup on TSLA and got whipsawed twice before realizing the settings needed adjustment for higher-volatility names.

VWMA Strategy Guide: Master Volume-Weighted Moving Average for Trading Success