Trend Strength Index Strategy: TSI Signals and Entry Rules
· 13 min read

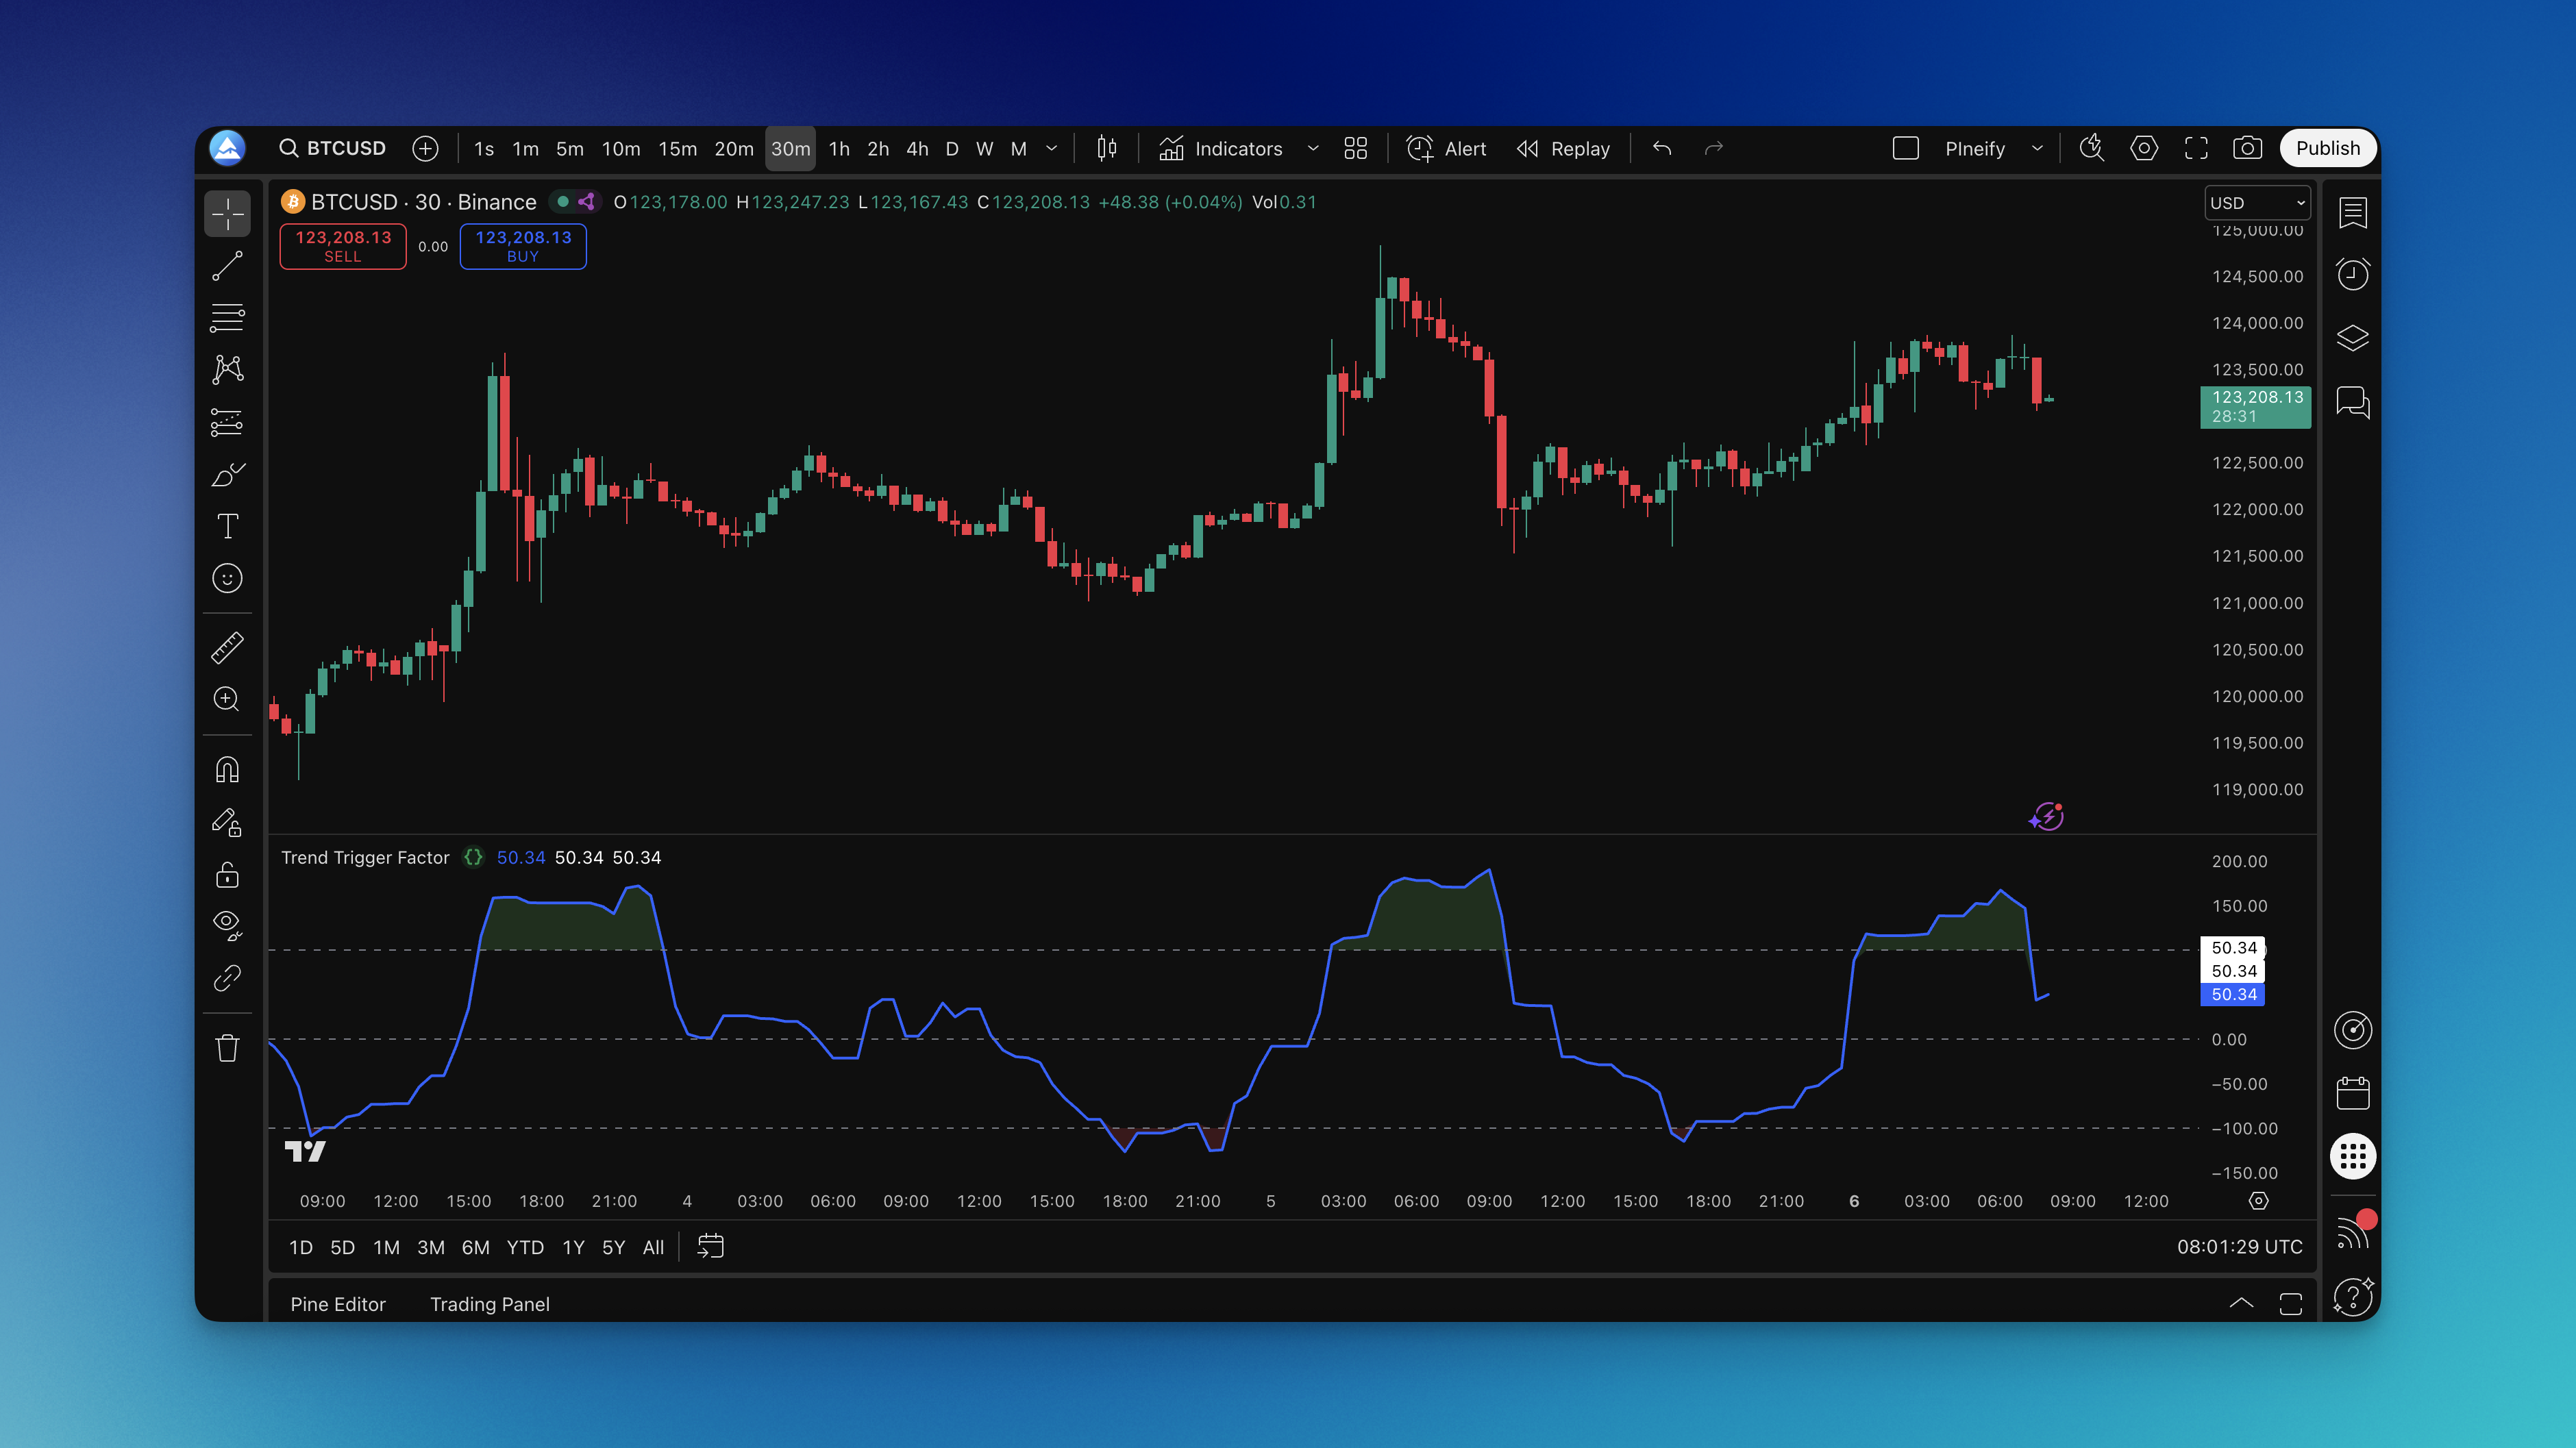
The Trend Strength Index (TSI) is a double-smoothed momentum oscillator that moves between -100 and +100 with a centerline at zero. Instead of reacting to every price wiggle, it applies two layers of exponential moving averages to the underlying momentum data. This filters out short-term noise and makes the real trend direction easier to spot. I've been using it on daily charts for about a year now, and it consistently gives cleaner reads than standard oscillators on stocks like AAPL and MSFT.