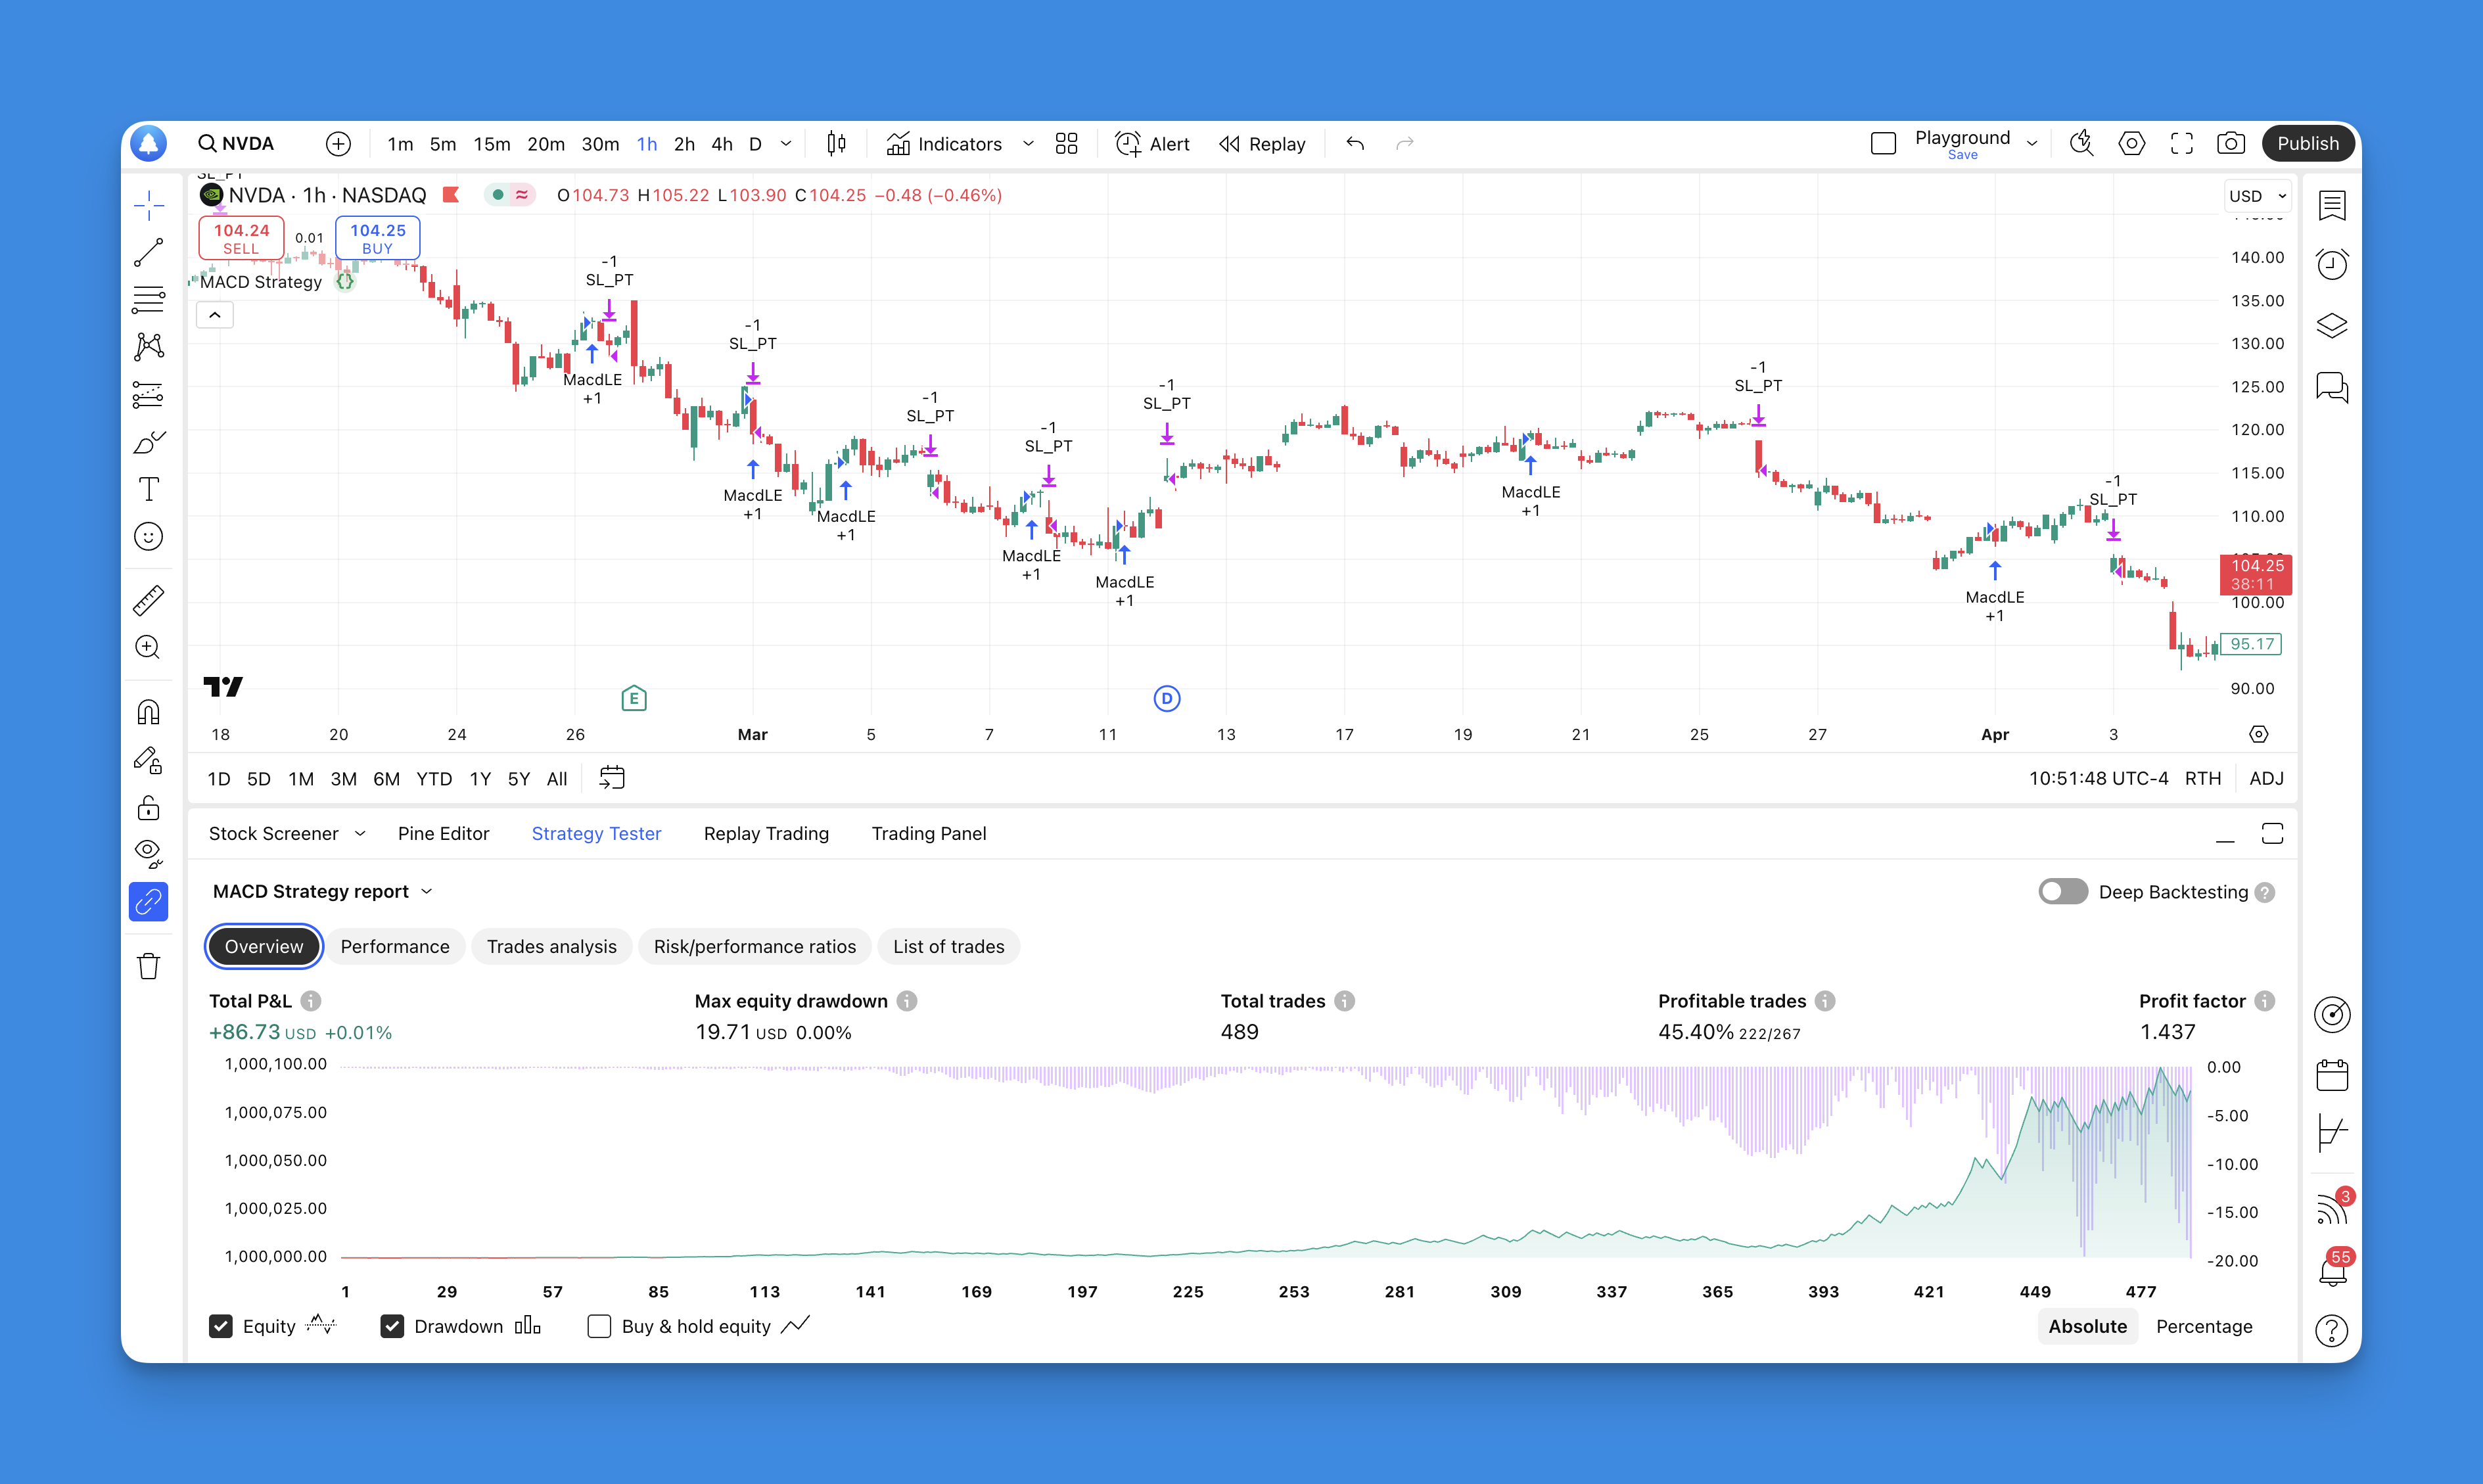
strategy.exit() Guide: Stop Loss, Take Profit & Trailing Stops
· 10 min read

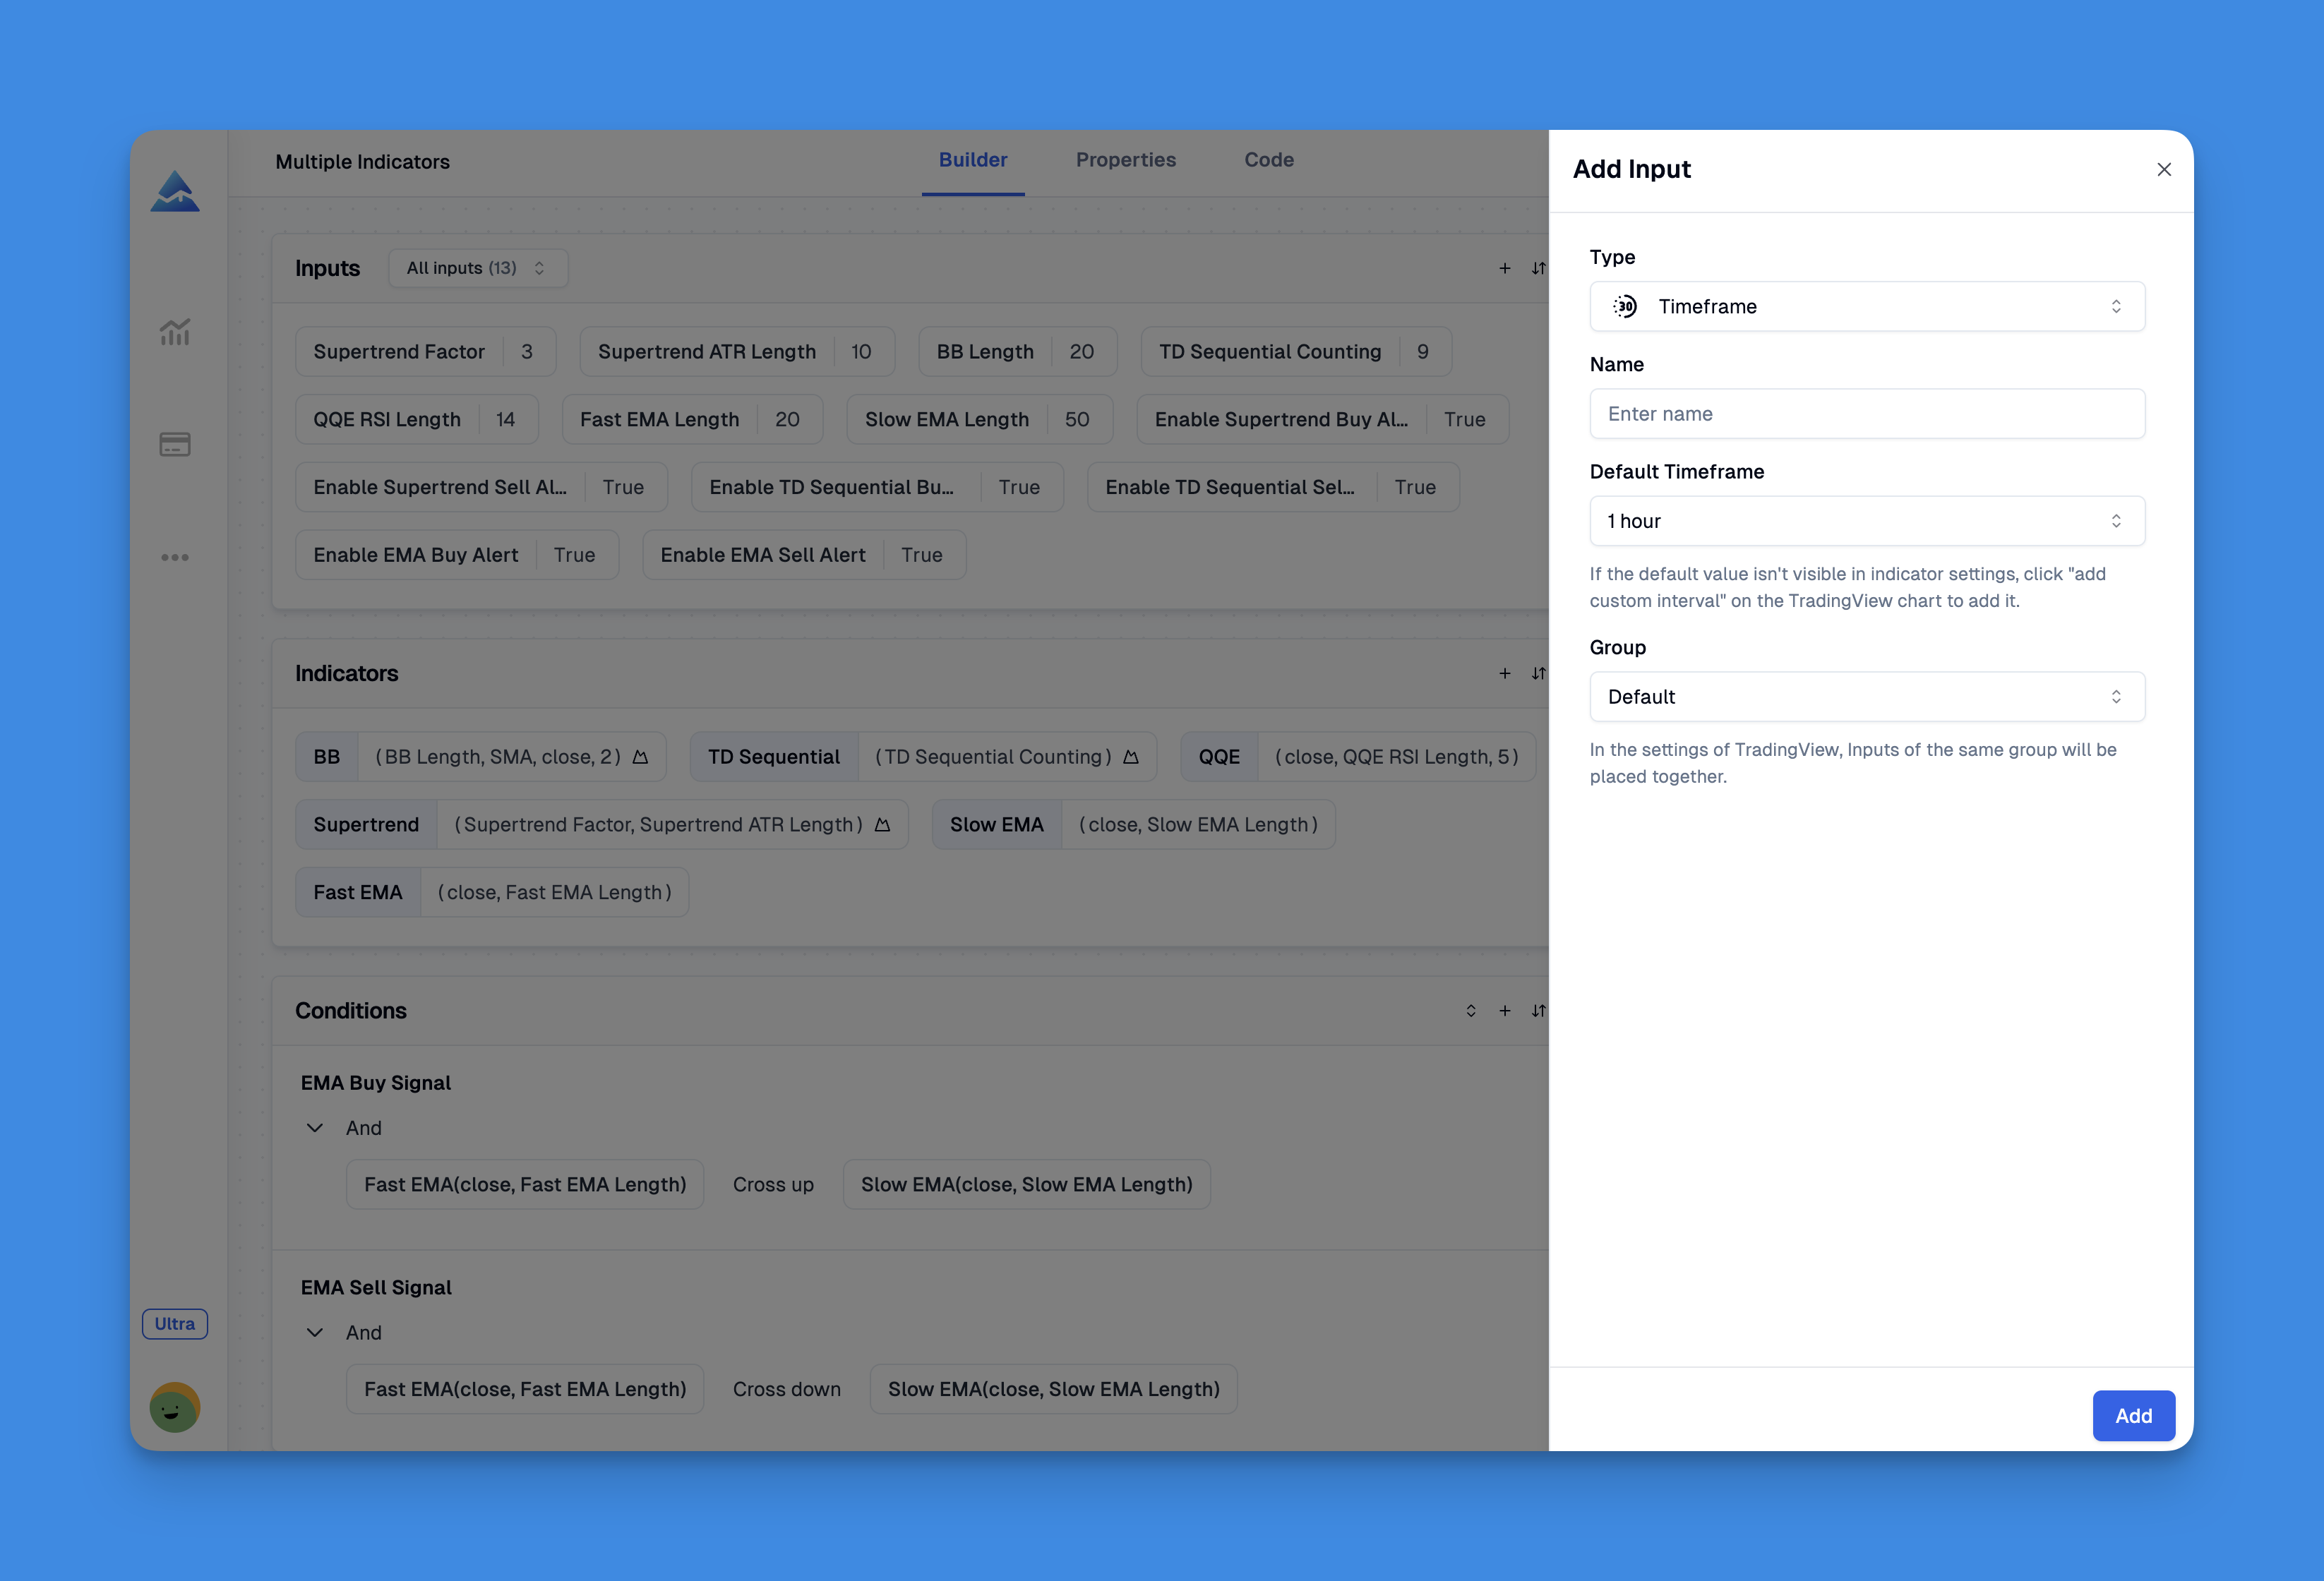
input.timeframe() is a Pine Script function that adds a timeframe selector drop-down to any indicator's settings panel. Pick '15m', '1h', or 'D' from the menu — no code edits. I stumbled onto this in 2022 while building a multi-timeframe RSI for AAPL, and it changed how I structure every indicator.
Before using it, I kept separate scripts for each resolution. RSI_5min, RSI_1hour, RSI_daily — a cluttered folder of near-identical files. input.timeframe() collapses all that into one clean script.
Pine Script timestamps are UNIX millisecond counters that tell you when each bar opened, closed, or where you are in real-time. Every bar on a TradingView chart carries one, and if you've built a strategy that needs to know what time it is, you've already dealt with them. I spent a whole afternoon debugging my first time filter on SPY — turned out I was comparing seconds to milliseconds.
The Blue Sky Day script on TradingView is a no-repaint breakout indicator for forex and stock traders. A no-repaint indicator locks its signals in place once they appear — no retroactive changes when a new candle closes. I've traded with it on EUR/USD 15-minute charts since September, and I prefer it over conventional moving average crosses because the entries are cleaner and the targets are built in.
MetaTrader 4 backtesting is the process of running your trading strategy through historical market data to evaluate its performance without risking real capital. I've run hundreds of these tests myself, and I can tell you: the gap between a strategy that looks good on paper and one that actually works is almost always revealed during a proper backtest. MT4's built-in Strategy Tester handles the simulation inside the platform you're already using, whether you're testing a manual rule set or an automated Expert Advisor (EA).
I've been watching AAPL since early October 2025, and the Momentum indicator caught something I nearly missed. Price was grinding higher, but the indicator had already peaked three weeks earlier. That bearish divergence saved me from buying into a $4 pullback.
The Momentum indicator measures the velocity of price changes by comparing the current price to a past price, typically 10 periods ago. A positive reading means prices are climbing; negative means they're falling. The steeper the line, the faster the move.
Momentum investing is about following the trend. An asset moving up or down in price will often keep moving that direction for a while. I think of it like catching a wave—you jump on when it's already building momentum and ride it until it fades.
Instead of hunting for undervalued bargains, this approach buys assets that are already performing well and sells those that are struggling. It's a "buy high, sell higher" mindset. Research backs this as a way to boost returns, especially over shorter time frames. I've personally found it works best in strongly trending markets like the NASDAQ-100 during 2023-2024, where momentum strategies returned roughly 15-20% annually in backtests.

I missed a TSLA breakout in March 2025 because I was glued to RSI — the price surged, but volume told the real story. That's when I started using the Money Flow Index (MFI). It's a momentum oscillator that weights each price bar by the volume behind it, so you see not just where price went, but whether real money pushed it there.
Most traders ignore the calendar and focus purely on price action. The Moon Phases trading strategy is different — it's a calendar-based system that uses the lunar cycle to time market entries and exits. New moons act as potential buy signals, and full moons act as potential sell signals. Researchers have found that stock returns in 48 global markets show a measurable pattern aligned with the moon's 29.53-day cycle, with full moon periods averaging 4-5 basis points lower daily returns than new moon periods.
The Moving Average Channel is a volatility-adaptive envelope indicator that draws upper and lower boundaries around a centerline moving average. It shows you the normal trading range for any asset and flags when price exits that range with momentum. I've been running this on ES futures 15-minute charts since March 2025, and the channel width contraction before the April 4 sell-off was impossible to miss.