Best Support and Resistance Indicator for TradingView Charts
· 14 min read

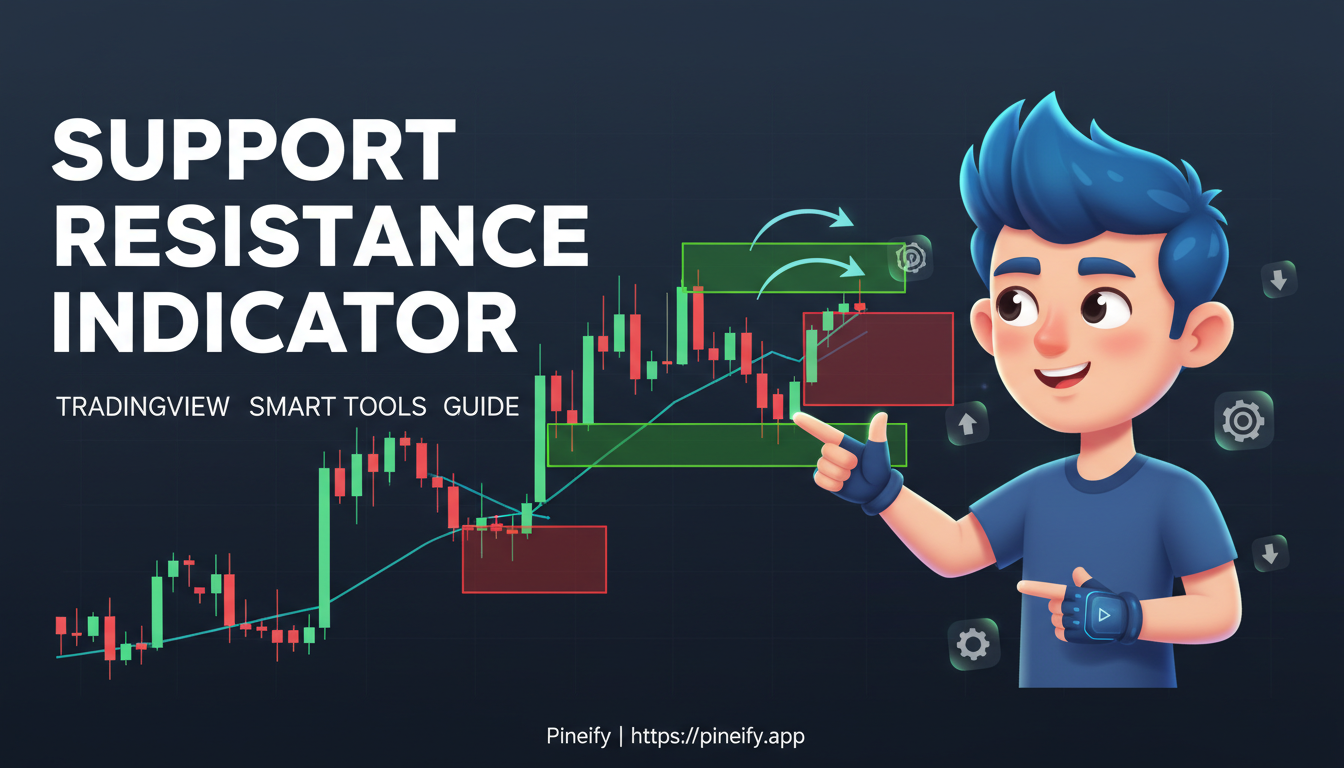
Support and resistance are price zones where buying and selling pressure concentrate, creating areas where trends pause or reverse. The classic pivot formula looks like this: Pivot Point = (High + Low + Close) / 3, with support and resistance levels projected from that midpoint. I've tested over a dozen indicators on TradingView to find which ones actually hold up in live markets. On Apple (AAPL), the $170 level acted as resistance four times in October 2024 before finally breaking — that's the kind of zone you want to spot before it moves. TradingView has plenty of tools for this job, but not all of them earn a spot on your charts.